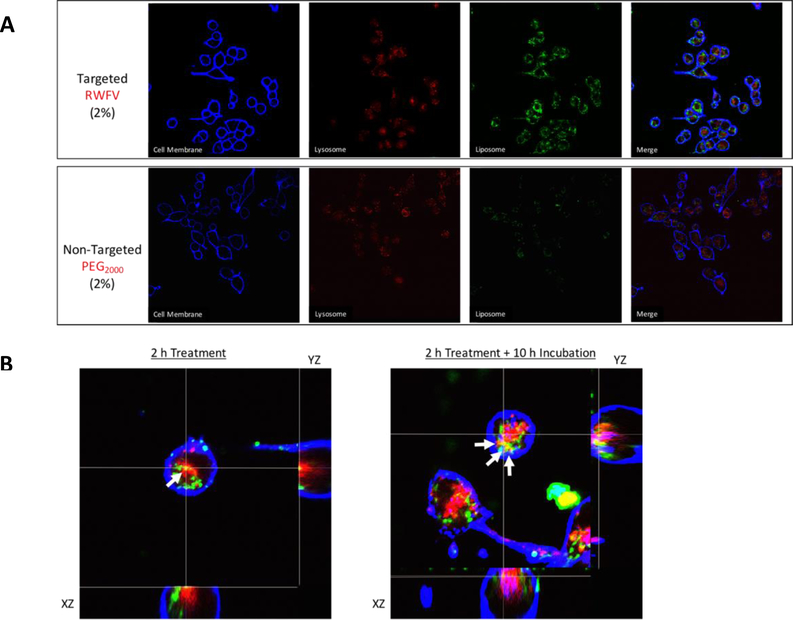
Figure 4.
A: Binding and intracellular trafficking of targeted (top) and non-targeted (bottom) liposomes in MB49 murine bladder tumor cells. MB49 cells were treated with liposome formulations in serum-free medium for 2 h at 37 °C prior to imaging by confocal microscopy. Targeted liposome composition: 62.5:35:2:0.5 DPPC:Chol:RWFV-PEG2000-DSPE:Cy5.5-DSPE. Non-targeted liposome composition: 62.5:35:2:0.5 DPPC:Chol:mPEG2000-DSPE:Cy5.5-DSPE. B: MB49 cells were treated with targeted liposomes (2 mol% RWFV-PEG2000-DSPE) for 2 h, followed by incubation for additional 0 h (left) or 10 h (right). Acidic lysosomes were stained with LysoTracker® Blue DND-22 and plasma membranes were stained with AlexaFluor® 680 WGA. Arrows indicate regions of coincident LysoTracker and FITC fluorescence, indicating the co-localization of FITC-labeled liposomes within acidic late endosome/lysosome compartments. Liposome diameters: 58 nm. Liposome composition: 62.5:35:2:0.5 DPPC:Chol:RWFV-PEG2000-DSPE:Cy5.5-DSPE.

