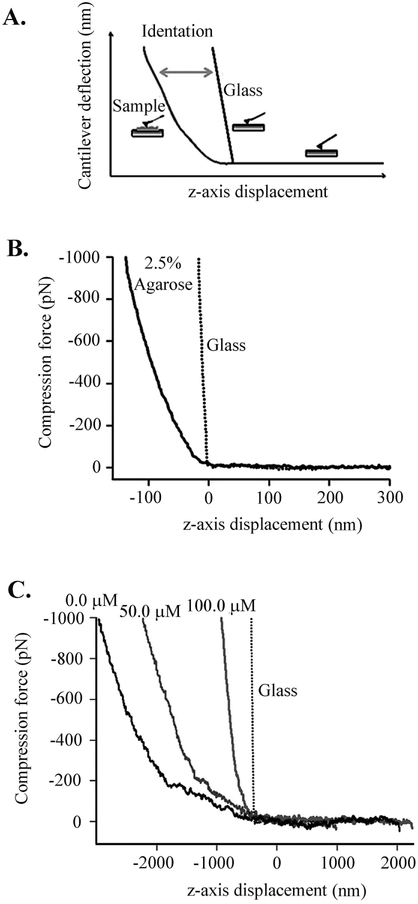
Figure 3. AFM compression analysis of ECM formed in vitro.
(A) Example of an AFM compression experiment. Elastic deformation is calculated by subtracting the force–displacement curve on glass, which served as a reference, from that on elastin film. (B) Force–displacement curves obtained on a glass coverslip and 2.5% agarose film. Agarose served as calibration reference, as it has a well-known elastic modulus of~ 0.02 MPa. The dotted line corresponds to the force-displacement curve on the glass coverslip. (C) Effect of AEEA (0.0, 50.0, or 100.0 μM) on force versus displacement during compression cycles. The average slope obtained for ECM samples with increasing concentrations of AEEA were as follows: 0.7 pN/nm (0.0 μM), 0.9 pN/nm (50.0 μM), and 3.1 pN/nm (100.0 μM).

