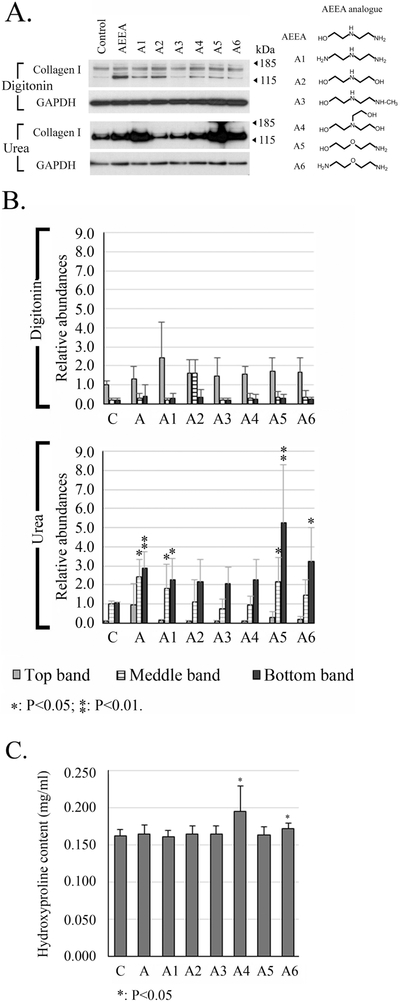
Figure 6. Chemical structure–activity relationship analysis of AEEA analogs.
HTS fibroblasts were treated with 50 μM of the indicated analog. A. The chemical structure of each is shown to the right. Western blots were performed to detect type I collagen. Digitonin: samples were extracted with native lysis buffer containing 1% digitonin. Urea: samples were extracted with urea lysis buffer after the extraction with native lysis buffer. B. Densitometry analysis: relative abundances were normalized to the top band of the control sample of the digitonin fraction. C. Quantitation of hydroxyproline in the pellets. (C: control; A: AEEA). These results were representative of at least three independent biological replicates.

