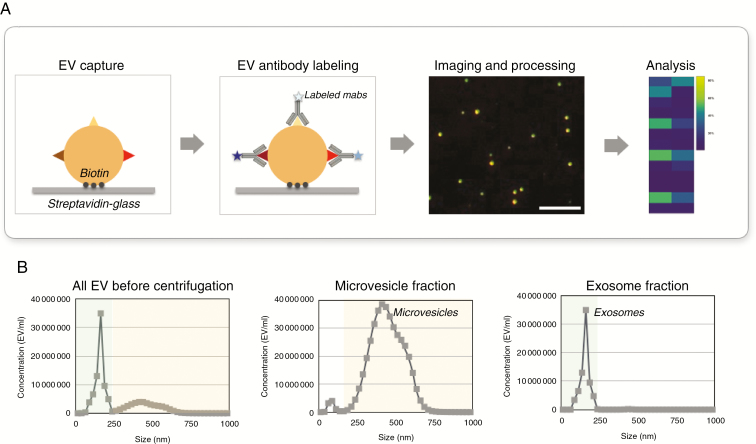
Fig. 1.
Overview of single vesicle analysis. (A) Overview of the procedural steps for single vesicle analysis. EV are biotinylated and captured on streptavidin-coated glass coverslips and stained by fluorescent antibodies. Coverslips are imaged by microscopy and multidimensional data are analyzed. Scale bar = 10 µm (B) Representative Nanosight Tracking Analysis (NTA) size distribution of vesicles from GBM8 media. NTA analyses are shown for samples before and after separation.

