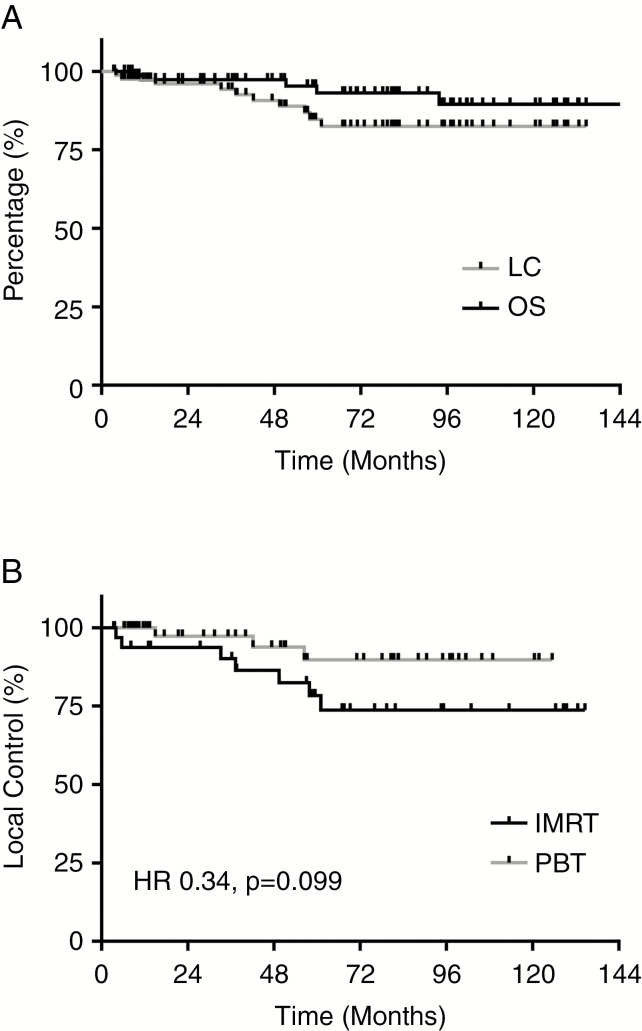
Fig. 3.
Disease-related outcomes. (A) Kaplan–Meier survival curves for overall survival (OS, black) and local control (LC, gray) for the full cohort. (B) Kaplan–Meier survival curves for LC by RT modality; trend toward improved LC for patients treated with PBT (gray) versus IMRT (black; HR 0.34, 95% CI: 0.10–1.18, P = 0.099).

