Fig. 3.
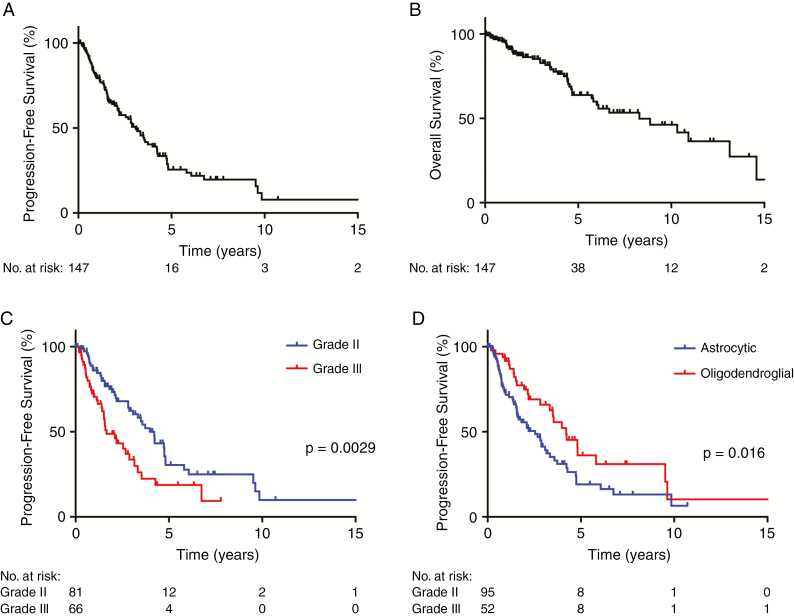
Kaplan–Meier plots showing (A) PFS and (B) OS in 147 patients with IDH mutant gliomas who experienced first episode of disease progression, in which time 0 indicates date of first progression. PFS in patients who experienced first episode of disease progression, stratified by (C) grade and (D) molecular status.

