Figure 1.
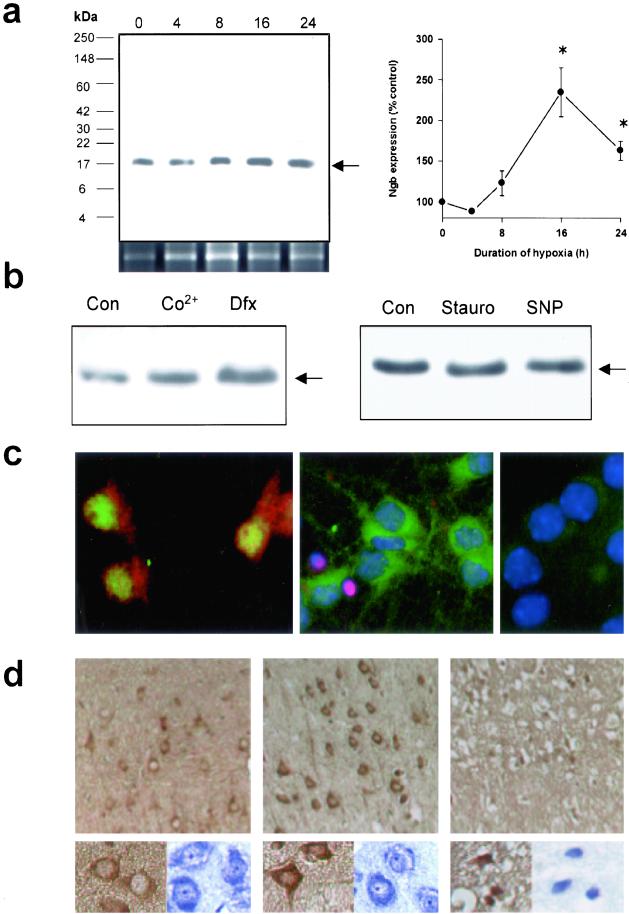
Neuronal hypoxia and ischemia induce Ngb protein expression. (a) Representative Western blot showing increased Ngb expression in cultured cortical neurons maintained without oxygen for the indicated number of hours (Left). Panel beneath the Western blot shows Ngb mRNA expression over the same time course. Expression of the 17-kDa band (arrow) was quantified by computer densitometry (mean ± SEM, n = 3; *, P < 0.05 relative to 0 h by t test) (Right). (b) Representative Western blots (n = 3) showing increased Ngb expression in cultures treated for 24 h with 300 μM Co2+ or 100 μM Dfx (Left), but no change with 0.1 μM staurosporine (Stauro) or 500 μM SNP (Right). (c) Fluorescence labeling of cultured cortical neurons showing Ngb immunoreactivity (red) in the cytoplasm of cells that express the neuronal nuclear antigen NeuN (green) (Left). Segregation of Ngb expression (green) and DNA damage (detected by labeling with the Klenow fragment of DNA polymerase I, red) into distinct populations, corresponding to viable cells with large nuclei (DAPI staining, blue) and nonviable cells with shrunken nuclei (Center). Preabsorption of the Ab with authentic Ngb peptide antigen abolished immunolabeling (Right). (d) Representative sections from contralateral, nonischemic rat cerebral cortex (Left) and penumbra (Center) or core (Right) of ischemic cerebral cortex at 24 h. Immunostaining for Ngb shows increased Ngb expression in the penumbra; this increased staining is localized to the cytoplasm of normal-appearing, unshrunken cells with neuronal morphology (Center, Insets). Brown, anti-Ngb; blue, cresyl violet. [Original magnification, ×400 (c and Insets to d) and ×200 (d)].

