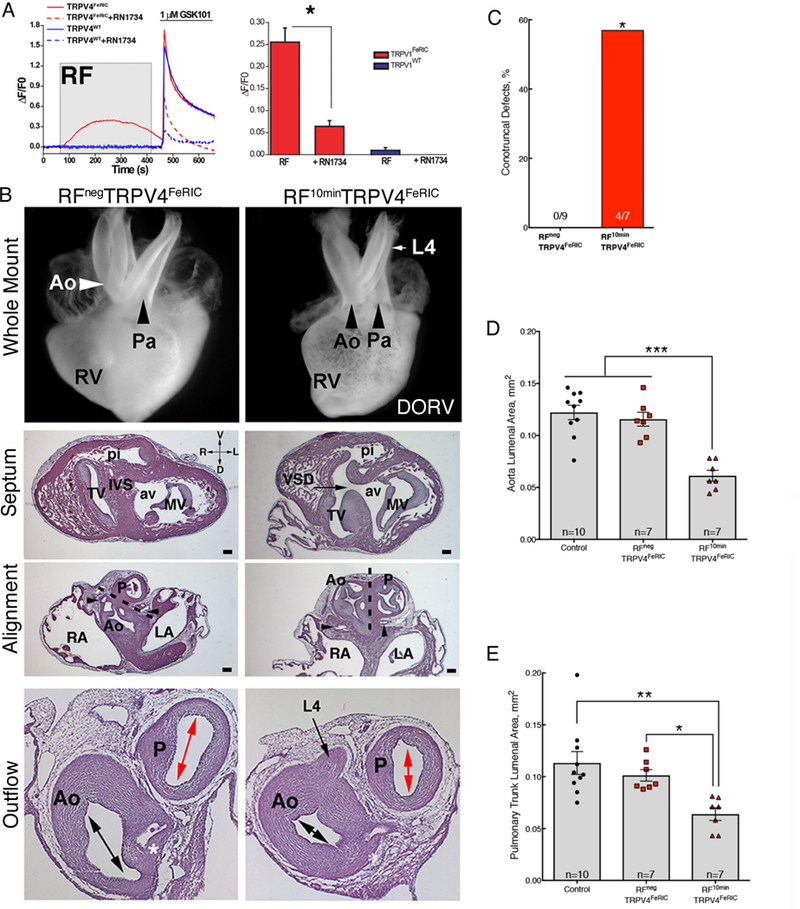
Fig. 8. Fever-associated heart defects following remote activation of TRPV4 in neural crest cells.

(A) GCaMP6 fluorescence in chick neural crest cells electroporated with TRPV4wt (blue lines) and TRPV4FeRIC (red lines) following RF (gray box) then GSK101 (bar). TRPV4 inhibitor RN1734 inhibits response (dashed lines). Bar graph shows cumulative responses representing 4 separate experiments with 45–49 cells/group analyzed. (B) Whole mount and histological sections of HH63 hearts from RFNegTRPV4FeRIC embryo and RF10minTRPV4FeRIC embryo with DORV and a persistent L4 arch artery. The white and black arrows in the whole mount images highlight the alignment of the aorta (Ao) and pulmonary trunk (P) in the RFNegTRPV4FeRIC and RF10minTRPV4FeRIC hearts. Histological sections of the whole mount in RPnegTRPV4FeRIC and RF10minTRPV4FeRIC hearts (above) at the level of the ventricular septum (IVS), at the level of the semilunar valves of the aorta (coronary arteries, black arrowheads) and pulmonary trunk and more distally through the smooth muscle walls of the aorta and pulmonary trunk at the level of the left coronary artery (*). The dashed line indicates the plane of outflow tract septation. Black arrows indicate a VSD and persistent L4 arch artery in the section through the RF10minTRPV4FeRIC heart. Double headed arrows indicate the luminal cross sectional areas of the aorta and pulmonary trunk measured in the Calvalieri estimates in (D-E). Bar = 200μm. 3 separate experiments were performed and a total of 9 RFNegTRPV4FeRIC and 7 RF10minTRPV4FeRIC hearts were analyzed. Tricuspid valve (TV), mitral valve (MV), aortic vestibule (av), pulmonary infundibulum (pi) right atrium, (RA), and left atrium (LA). (C) Percentage of histologically confirmed conotruncal defects in RFNegTRPV4FeRIC embryos compared to RF10minTRPV4FeRIC embryos. (D) Graph of the Cavalieri probe estimates of cross sectional areas through the aorta at the level of the coronary artery in the indicated treatment groups (CE=0.05). (E) Graph of the Cavalieri probe estimates of the cross-sectional areas through the pulmonary trunk distal to the semilunar valve in the indicated treatment groups. (CE=0.05). Significance was determined using unpaired t-test (A), Fisher exact test (C) or one-way ANOVA followed by Bonferroni’s multiple comparisons test (D,E). *P<0.02, **P<0.005, ***P<0.0001. The number of biological replicates is indicated by n in the graphs in (C, D and E).
