Fig. 3:

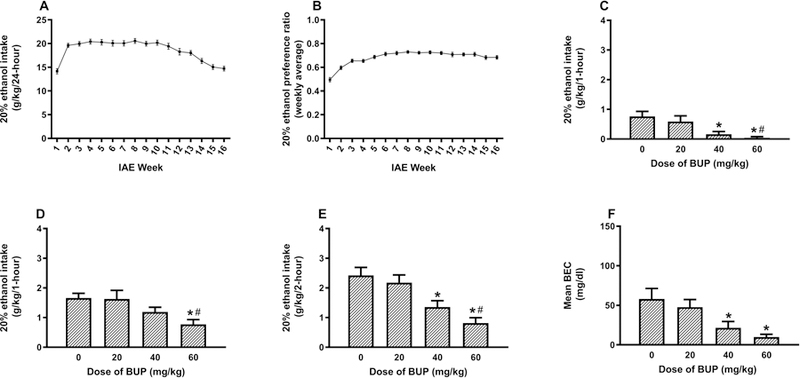
Consumption of a 20% (v/v) ethanol solution beginning 30-minutes after administration of vehicle (0 mg/kg) or BUP (20, 40, or 60 mg/kg; i.p.) in mice with 16-days of prior experience with IAE. Panel A shows average daily ethanol consumption, and Panel B shows ethanol preference ratios, averaged over each of the 16-weeks of testing. Panels C and D show ethanol consumption during the first and second hours of testing, respectively, and panel E shows cumulative ethanol consumption over the 2-hour test. Panel F shows BECs that were assessed immediately after the 2-hour test. Data are presented as means + SEM, and * = p < 0.05 relative to the vehicle group. # = p < 0.05 relative to the 20 mg/kg group.
