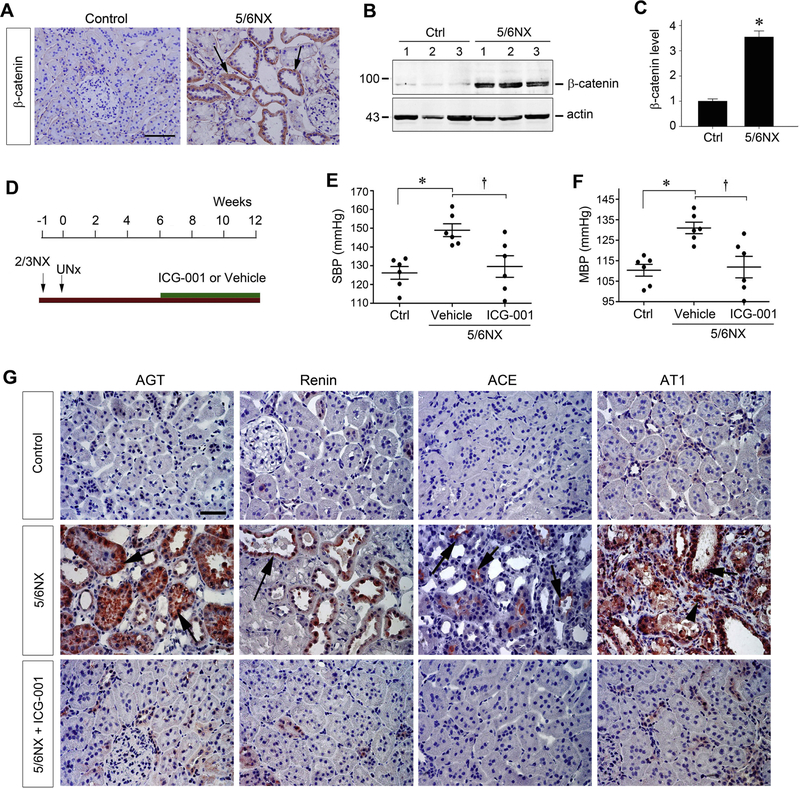
Figure 3.
Inhibition of Wnt/β-catenin signaling by ICG-001 normalizes blood pressure and activation of renin-angiotensin system in rat remnant kidney model. (A) Wnt/β-catenin is activated in rat remnant kidney model in vivo. Representative micrographs demonstrate the expression and localization of β-catenin in remnant kidney. Rat kidney sections from sham control and 5/6NX at 12 weeks were stained immunohistochemically for β-catenin protein. Arrows indicate β-catenin–positive staining in renal tubules. Scale bar, 50 μm. The images were representative from 6 rats per group. (B and C) Western blot analyses show a dramatic increase in renal β-catenin abundance after 5/6NX. Representative Western blot (B) and quantitative data (C) are presented. Data are means ± SEM of 6 animals per group. *P < 0.05 versus sham controls (n=6). (D) Diagram shows experimental design. Green bar shows the treatment schedule of ICG-001 or vehicle. (E, F) Blood pressure was measured using the tail-cuff technique at 12 weeks after 5/6NX. Both systolic blood pressure (E) and mean blood pressure (F) are shown, respectively. *P < 0.05 versus sham controls; †P < 0.05 versus vehicle (n=6). Scale bar, 50 μm. (G) Kidney paraffin sections from different groups were stained for angiotensinogen (AGT), renin, angiotensin-converting enzyme (ACE) and angiotensin II type 1 receptor (AT1), respectively. Arrows indicate positive staining in renal tubules, and arrowhead denotes AT1-positive interstitial cells. The images were representative from 6 animals per group.

