Figure 6.
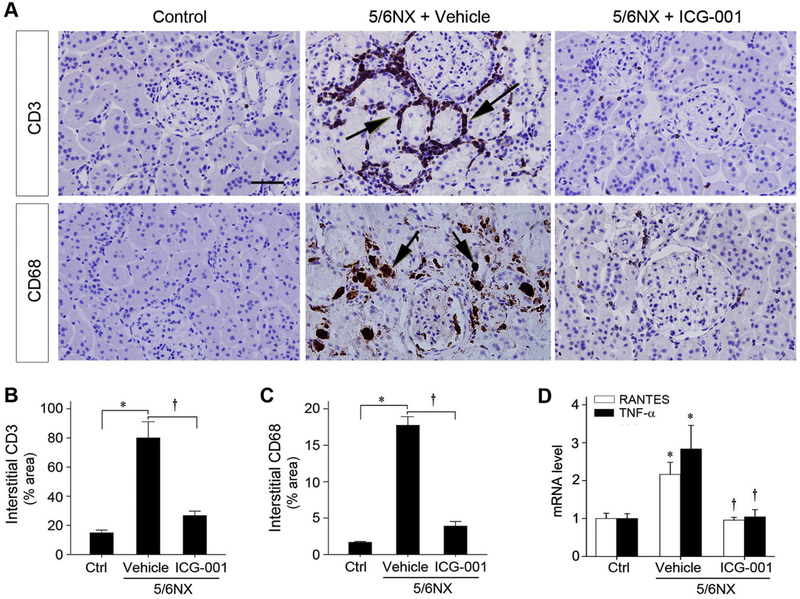
ICG-001 attenuates inflammatory infiltration and represses proinflammatory cytokines expression. (A) Representative micrographs show renal infiltration of CD3+ T cells and CD68+ monocytes/macrophages. Kidney sections from different groups were immunohistochemically stained with specific antibodies against CD3 and CD68 antigens, respectively. Arrows indicate positive staining. Scale bar, 50 μm. (B, C) Quantitative determination of CD3− (B) and CD68− (C) positive cells in various groups as indicated. *P < 0.05 versus sham controls, †P < 0.05 versus vehicle (n=6). (D) Graphic presentation shows the relative mRNA levels of RANTES and TNF-α mRNA determined by qRT-PCR. Relative mRNA levels were determined after normalization with β-actin and expressed as fold induction over sham controls. Data are expressed as mean ± SEM. *P < 0.05 versus sham controls, †P < 0.05 versus vehicle (n=6).

