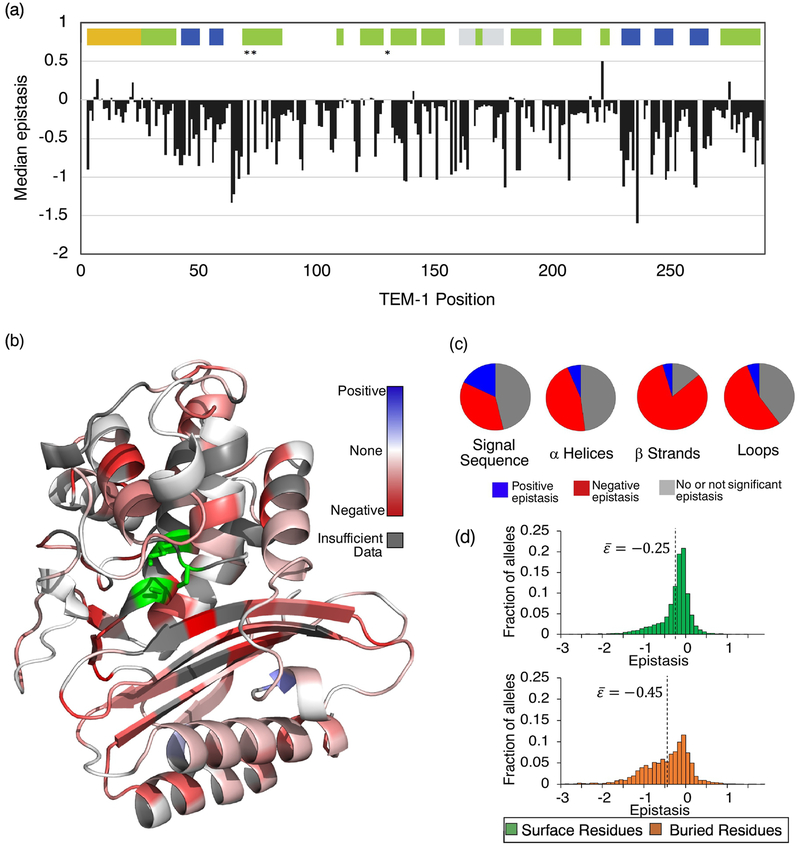
Fig. 3. The relationship between protein sequence, structure, and epistasis in TEM-1.
(a) Median epistasis values across the TEM-1 primary sequence. Median values were calculated only for position pairs with 5 or more epistasis values. Median epistasis for a mutation pair is plotted at the first position of that pair. Colored bars indicate regions that code for the signal sequence (yellow), alpha helices (green), beta strands (blue), and the omega loop (grey). Asterisks indicate the location of important catalytic residues. (b) Median epistasis values mapped onto the TEM-1 structure. Active site residues are indicated in green. (c) Frequency of positive epistasis (blue), negative epistasis (red), and no or not significant epistasis (grey) in the signal sequence and secondary structure elements. Data are categorized by the structural identity of the first mutation. Distribution of fitness values for these categories is provided as Supplementary Fig. S3. (d) Epistasis distributions for buried and surface residues. The median value of the distribution is indicated.

