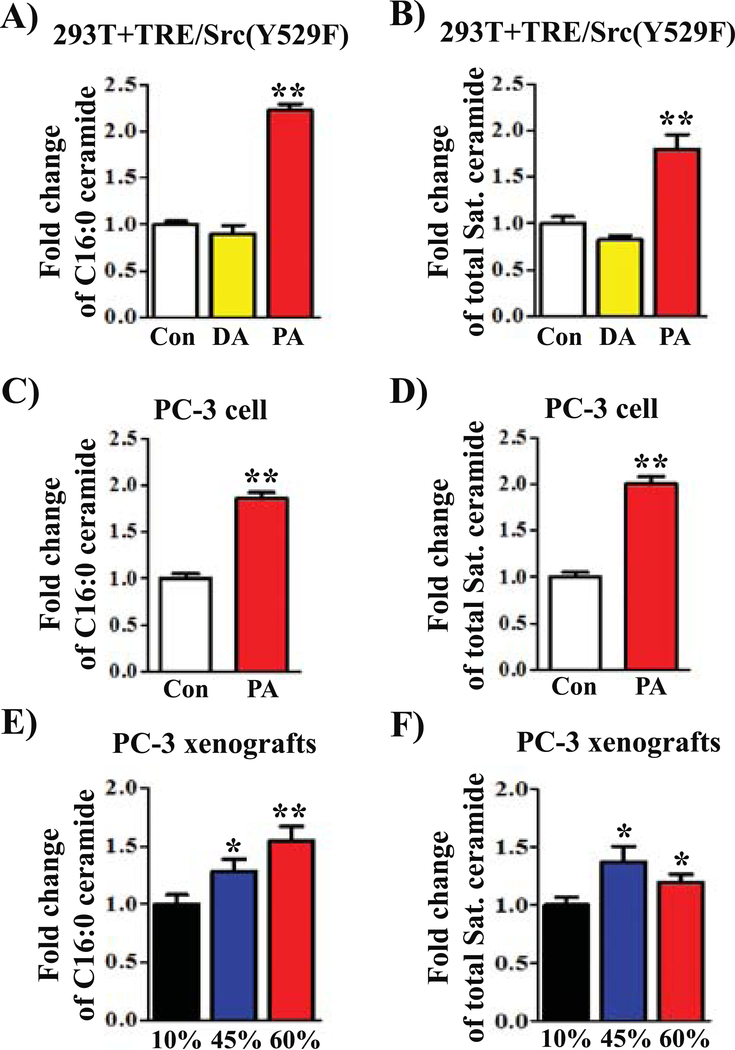
FIGURE 5. Exogenous palmitic acid or a high fat diet change ceramide compositions.
(A-D) 293T cells expressing Src(Y529F) (A-B) and PC-3 prostate cancer cells (C-D) were grown in DMEM medium with DMSO control (Con), 400 μM palmitic acid (PA, C16:0), or 600 μM decanoic acid (DA, C10:0) for 24 hours. The cells were collected for lipidomics analysis. (E-F) PC-3 xenograft tumors from mice placed on 10%, 45%, or 60% fat diets were collected for ceramide analysis. Ceramide profiles (also see the Supplemental Figure 4) were measured by HPLC-MS/MS described in Materials and Methods. Fold changes of C16:0 ceramide (A, C, and E) and total saturated ceramide profiles (B, D, and F) were calculated. The amount of the control treatment was set as 1. *: p<0.05; **: p<0.01.

