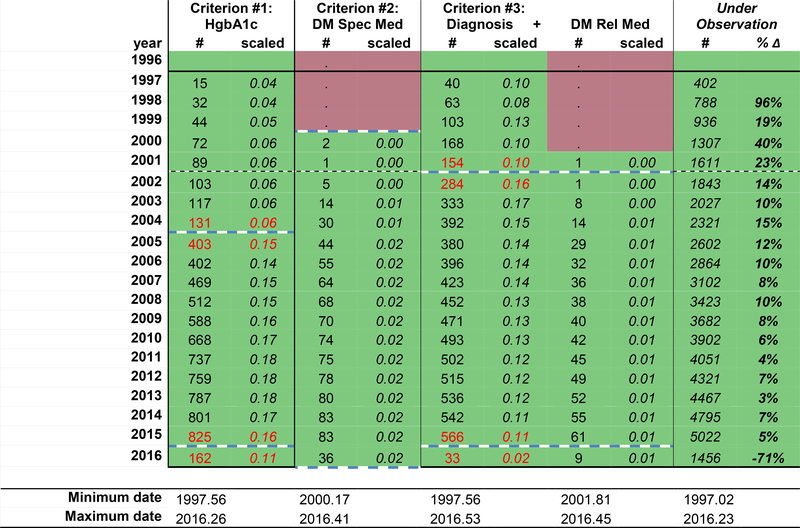
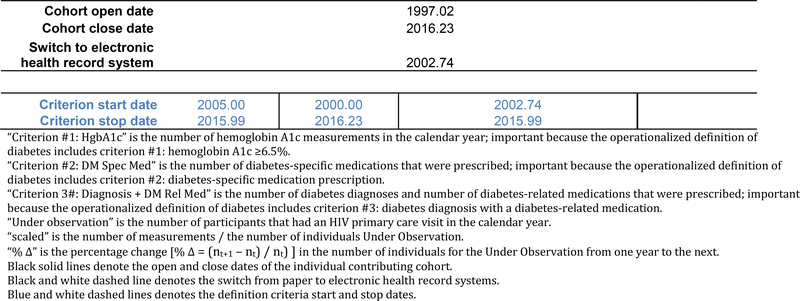
Figure 1c:
The hypothetical individual contributing cohort’s number of measurements scaled by the number under observation, the percent change in the number of individuals from one year to the next, the change of +/− 0.05 in scaled measurements from one year to the next (red text), and the start and stop dates for each diabetes definition criteria (dashed blue lines).


