Fig. 2.

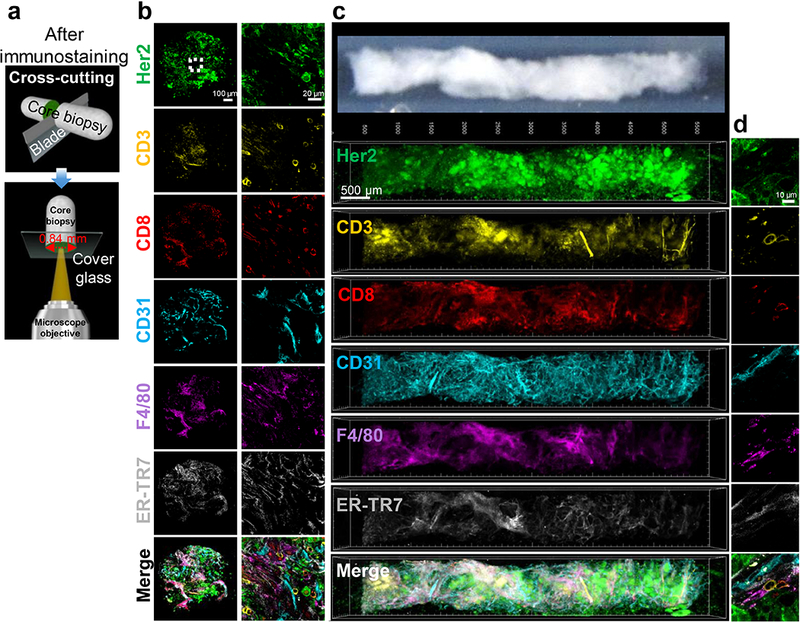
Multiplex fluorescent immunostaining and 3D image reconstruction of whole core needle biopsies using T3. a Diagram shows slicing and imaging of cross-section of cores to assess antibody penetration after multiplex immunostaining. b Cross section images from BALB-NeuT tumor core after immunostaining for Her2 (green), CD3 (yellow), CD8 (red), CD31 (cyan), F4/80 (magenta), and ER-TR7 (gray). Left column shows 10X objective scan of 0.84 mm diameter core. Right column shows 40X objective region-of-interest imaging of the center of the cross section (white dotted square) demonstrating staining of tumor cells, T cells, microvasculature, macrophages, and fibroblasts. Scale bars: 100 μm (left) and 20 μm (right). c Six-plex immunostaining, clearing, scanning and image analysis of a whole BALB-NeuT tumor core (top image) reveals 3D distributions of Her2 tumor cell marker (green), CD3 T cell marker (yellow), CD8 cytotoxic T cell marker (red), CD31 endothelial marker (cyan), F4/80 macrophage marker (magenta), and ER-TR7 fibroblast marker (gray), displaying each channel in pseudocolor individually and in a merged image. Scale bar: 500 μm. d High resolution 2D images of the cell markers in the core. Scale bar: 10 μm.
