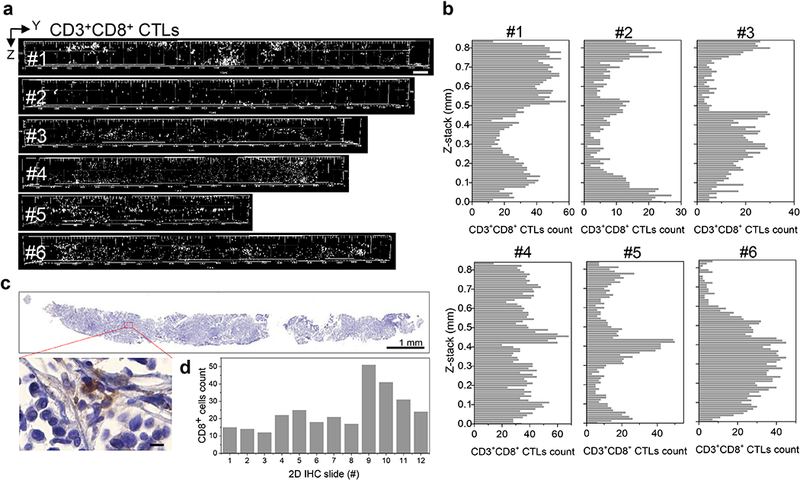
Fig. 3.

3D mapping and analysis of cytotoxic T lymphocytes in whole mouse core needle biopsy. a 3D spatial mapping of CD3+CD8+ cytotoxic T lymphocytes (CTLs) in cores from six NeuT tumors displays local clustering and inhomogeneity. Scale bar: 500 μm. b Enumeration of CTLs in virtual optical sections along the long axis of each core in a demonstrates heterogeneous distribution of CTLs. c Conventional IHC after T3 confirms non-uniform distribution of CD8+ cells. Core #1 in a was formalin fixed and paraffin embedded, sectioned, immunostained, counterstained, and scanned. Inset displays high-magnification image of CD8+ cells. Scale bar: 1 mm (top) and 10 μm (inset). d Manual counting of CD8+ cells after IHC. Every seventh 5 μm serial section was stained and counted.
