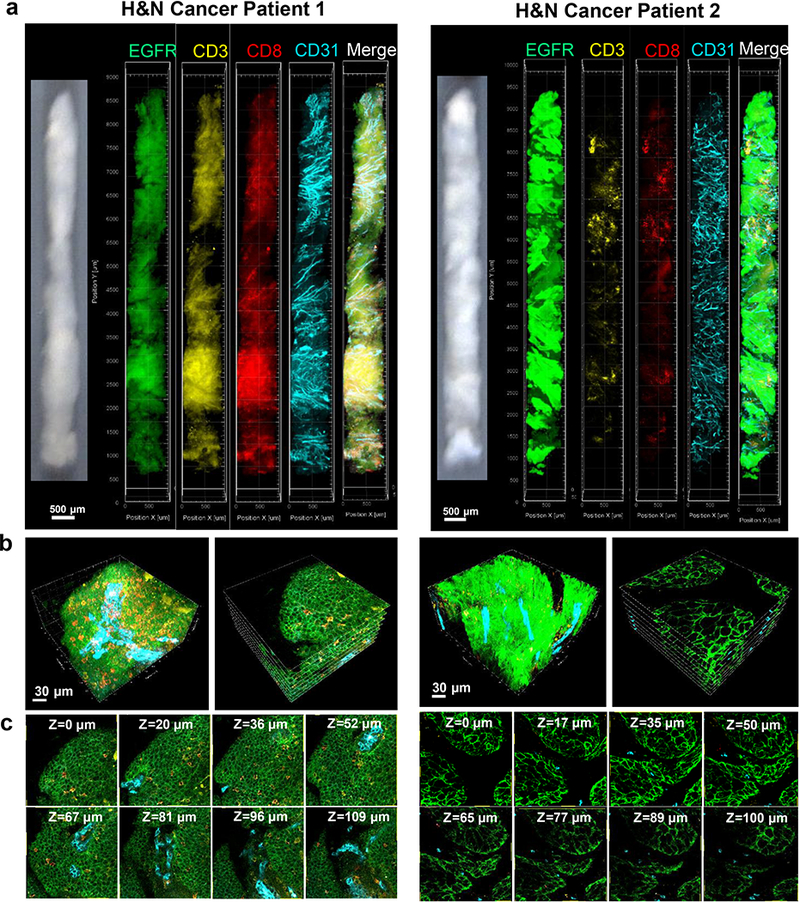
Fig. 4.

3D visualization and mapping of CTLs in whole head and neck cancer cores. a Cores obtained with an 18 gauge automated device from head and neck cancer samples from patients 1 and 2 (left images) were immunostained for EGFR (green), CD3 (yellow), CD8 (red), and CD31 (cyan), cleared and scanned. 3D rendering of whole cores are shown for each channel and a merged image. Scale bar: 500 μm. b High resolution 3D view (left) and X-Y tomographic visualization (right) of a volume within the rendered core models, showing distributions of CD3+CD8+ CTLs (orange) and CD31+ endothelium (cyan) within the EGFR+ (green) tumor tissue and stroma. Scale bar: 30 μm. c Serial tomographic sections of X-Y planes at different Z-stack depths showing CTLs (orange) and endothelium (cyan) within the EGFR+ (green) tumor tissue.
