Figure 2.
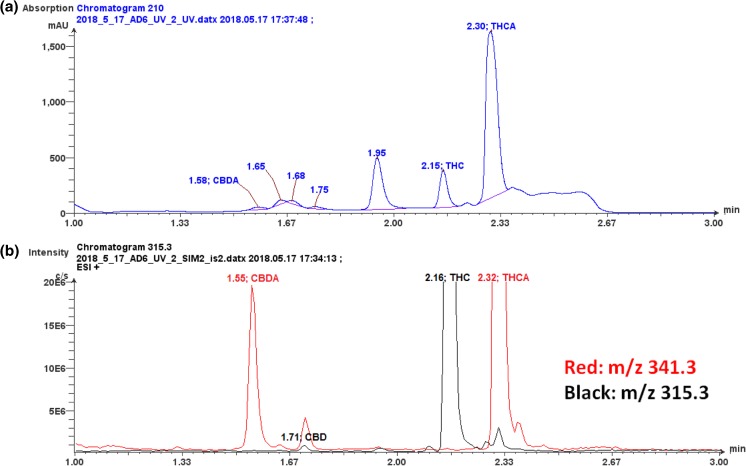
(a) LC/UV chromatogram of a cannabis extract showing expected abundant peaks for THC and THCA but other unknown chromatographic components which can interfere with the assessment of the quantity of other lower level cannabinoids. The multiple low-level peaks in the 1.4–1.9 min retention time region make it difficult to selectively quantitate cannabinoids which elute in this region. (b) LC SIM/MS analysis of the same extract shown in (a) where the protonated molecules for the targeted cannabinoids, CBDA, and CBD along with THC and THCA were monitored. Note: The Y-axis of (b) has been amplified by × 10 in order to clearly show the presence of the lower levels observed for CBDA and CBD. This naturally amplifies the THC and THCA peaks off scale as observed in (b) but clearly shows the presence of CBDA and CBD which were obscured in (a). The separation was achieved using an Agilent Eclipse Plus RRHD C18 (50 × 2.1 mm, 1.8 μm), mobile phase consisted of 0.1% formic acid in water and 0.1% formic acid in acetonitrile. The LC/UV chromatogram (A) was obtained at a wavelength of 210 nm and the LC/MS chromatogram (b) was collected using a single quadrupole mass spectrometer (Advion, Inc., Ithaca, NY) equipped with electrospray ionization under positive selected ion monitoring conditions

