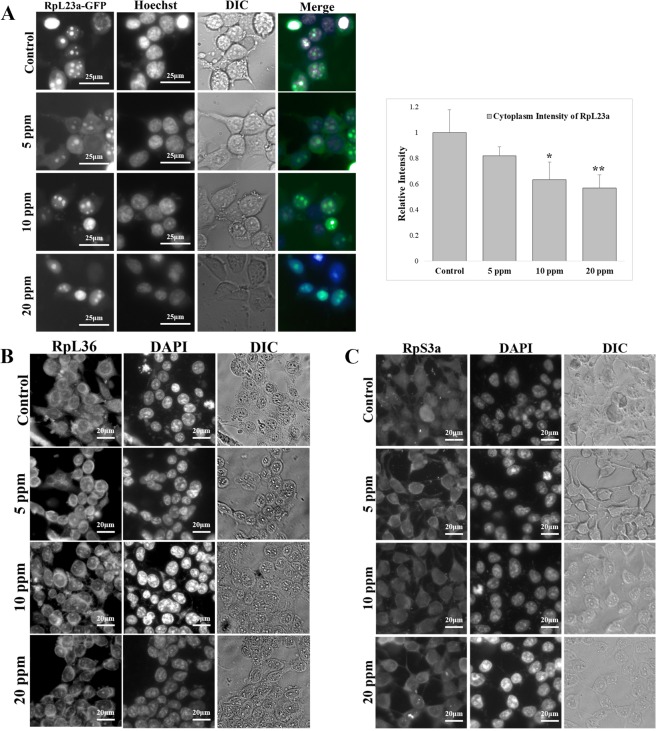
Figure 8.
The localization of large ribosomal proteins were nuclear accumulation in treatment groups. (A) The HEK293T cells expressing RpL23a-GFP were treated with different concentrations of thallium. And the protein localization of RpL23a was imaged by fluorescent microscopy. Cell nuclei were stained with Hoechst. The cytoplasmic intensity of RpL23a was measured with Image J and shown in the bar graph (n = 20). Scale bars, 25 μm. Error bars represent SD. Student’s t tests relative to the control were performed. *p < 0.05, **p < 0.01. (B,C) Immunofluorescence staining of RpL36 (B) and RpS3a (C) with anti-RpL36 and anti-RpS3a. DNA was stained by DAPI. Scale bars, 20 μm.

