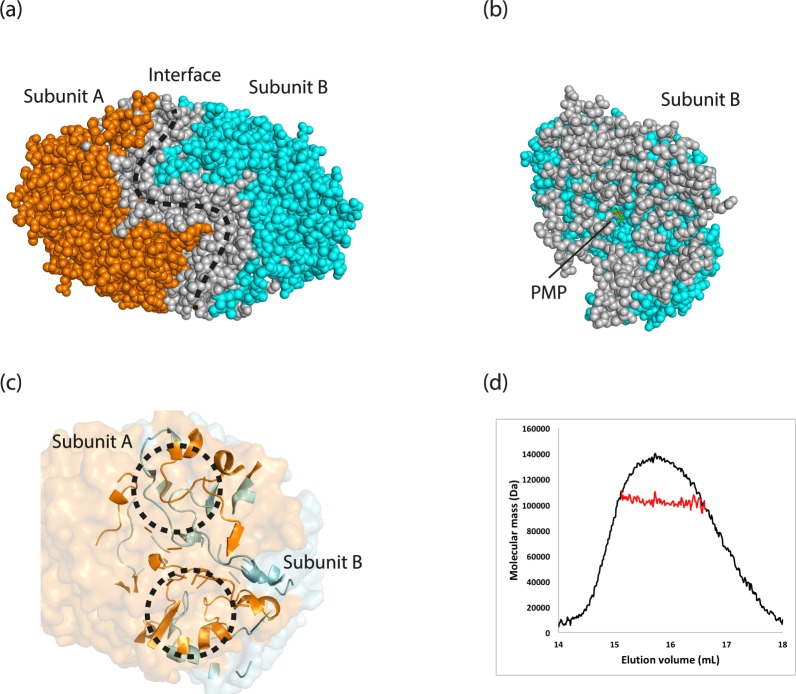
Figure 2.
Dimer formation of Tr-ωTA. (a) Interactions between the two subunits of Tr-ωTA. Subunit A, B, and the interface are represented as orange, cyan, and grey spheres, respectively. (b) A cross section of subunit B containing PMP. PMP is depicted as sticks. (c) Loop insertion at the interface. The black dashed circles indicate inserted loops between the two subunits. The colour code is the same as in panel a. (d) SEC-MALS profile of Tr-ωTA. SEC-coupled MALS data (red) are plotted as elution volume and molecular mass distributions, and superimposed on the SEC chromatogram (black) at 280 nm.

