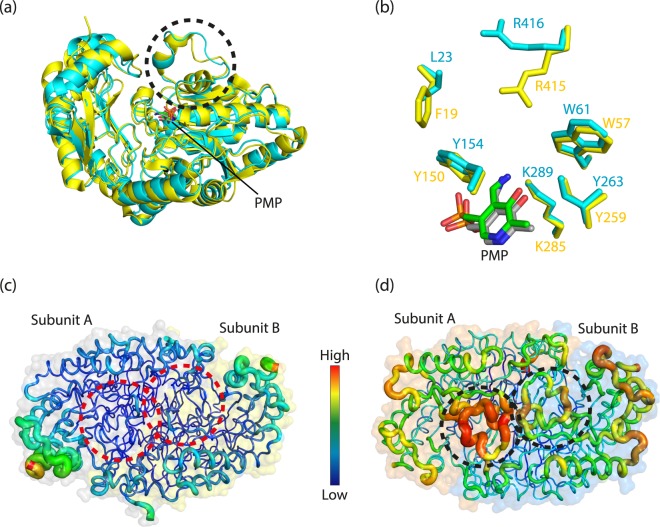
Figure 5.
Structural comparison of Tr-ωTA with Vf-ωTA. (a) Overall structural comparison between Tr-ωTA and Vf-ωTA. Subunit B of Vf-ωTA is superimposed onto that of Tr-ωTA. The structures of Tr-ωTA and Vf-ωTA are colored cyan and yellow, respectively. The apo enzymes and PMP are shown in cartoon and stick representations, respectively. (b) Zoom-in view of the PMP cofactor in a different orientation. The PMP molecules and key residues of the active site are shown. The PMP cofactors of Tr-ωTA and Vf-ωTA are colored green and grey, respectively. B-factor distribution of Vf-ωTA (c) and Tr-ωλTA. (d) The two structures are depicted in putty representation and rainbow-colored from red to violet in B-factor value order. The dashed circles correspond to those in panel a.

