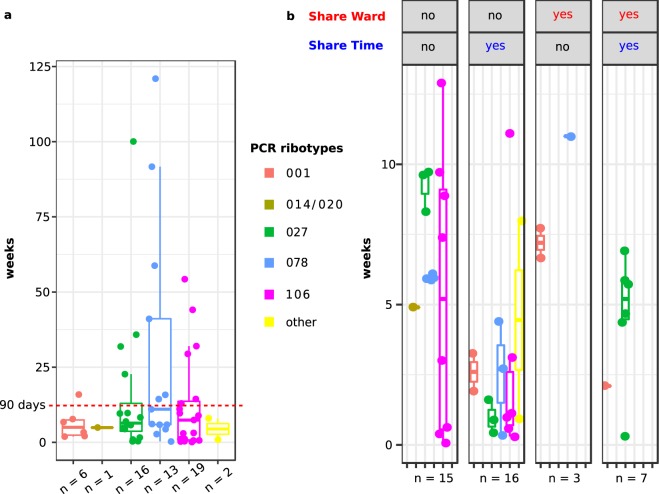
Figure 2.
Time intervals between isolates from putative transmission events. Each dot represents one pair of closely related C. difficile isolates (i.e., ≤2 core-genome SNPs). Horizontal lines indicate the median values, boxes indicate the first and third quartiles, respectively, and vertical lines indicate the maximum and minimum values. Colours indicate the PCR ribotypes. (a) 57 putative transmission events. Isolates were linked genetically, but 30% of closely related isolates had been recovered more than 90 days apart. (b) Stratification based on information whether CDI patients had stayed at the hospital during the same time or on the same medical ward, respectively. Patients associated with 17% of putative transmission events shared time on the same ward, and patients from 39% of putative transmission events shared time at the hospital, but on separate wards. Only isolates that were linked genetically and temporally (i.e., ≤2 SNPs, ≤90 days) are shown.

