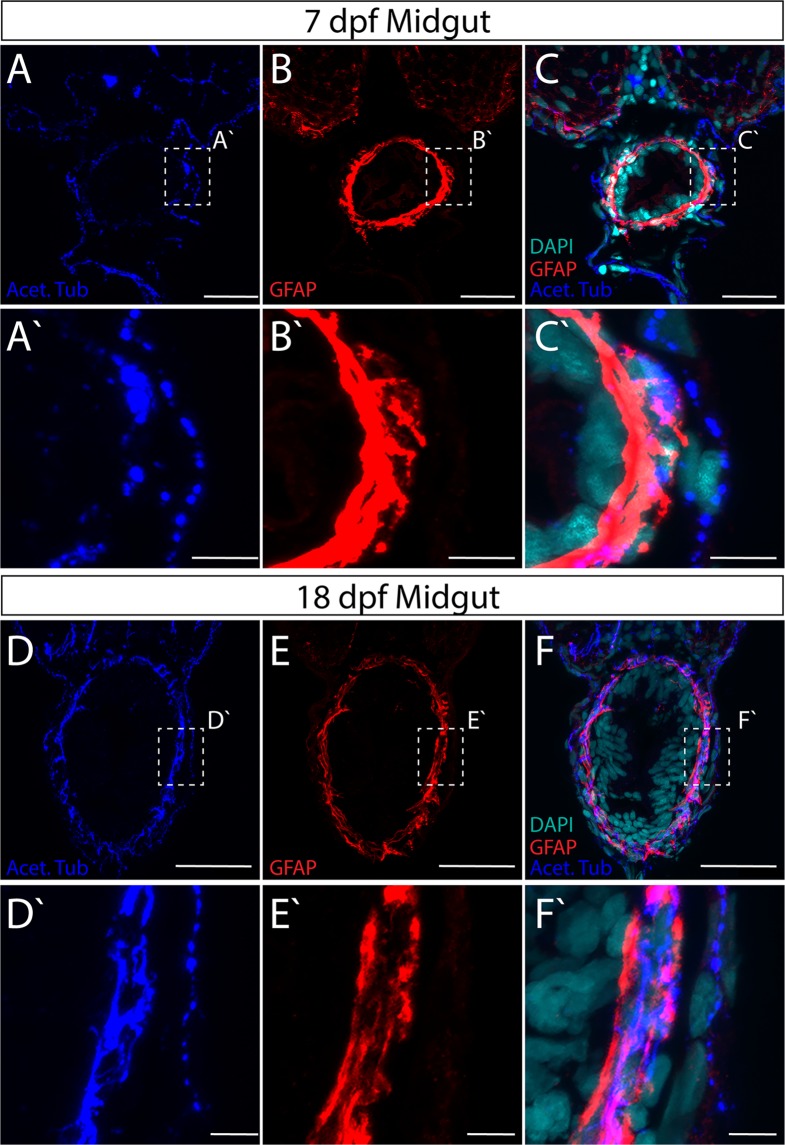
Figure 4.
Axon and glial cell patterning within the myenteric plexus of the larval zebrafish midgut. Maximum intensity confocal projections of transverse cryosections indicate GFAP+ (red) and Acet-Tub+ projections (blue) in in the midgut of (A–C) 7 dpf larvae, scale bar: 20 microns, and (D–F) 18 dpf larvae, scale bar: 40 microns. Nuclei revealed by DAPI (cyan). White-dashed box corresponds to region of magnification (A′–C′) scale bar: 5 microns, and (D′–F′) scale bar: 5 microns.

