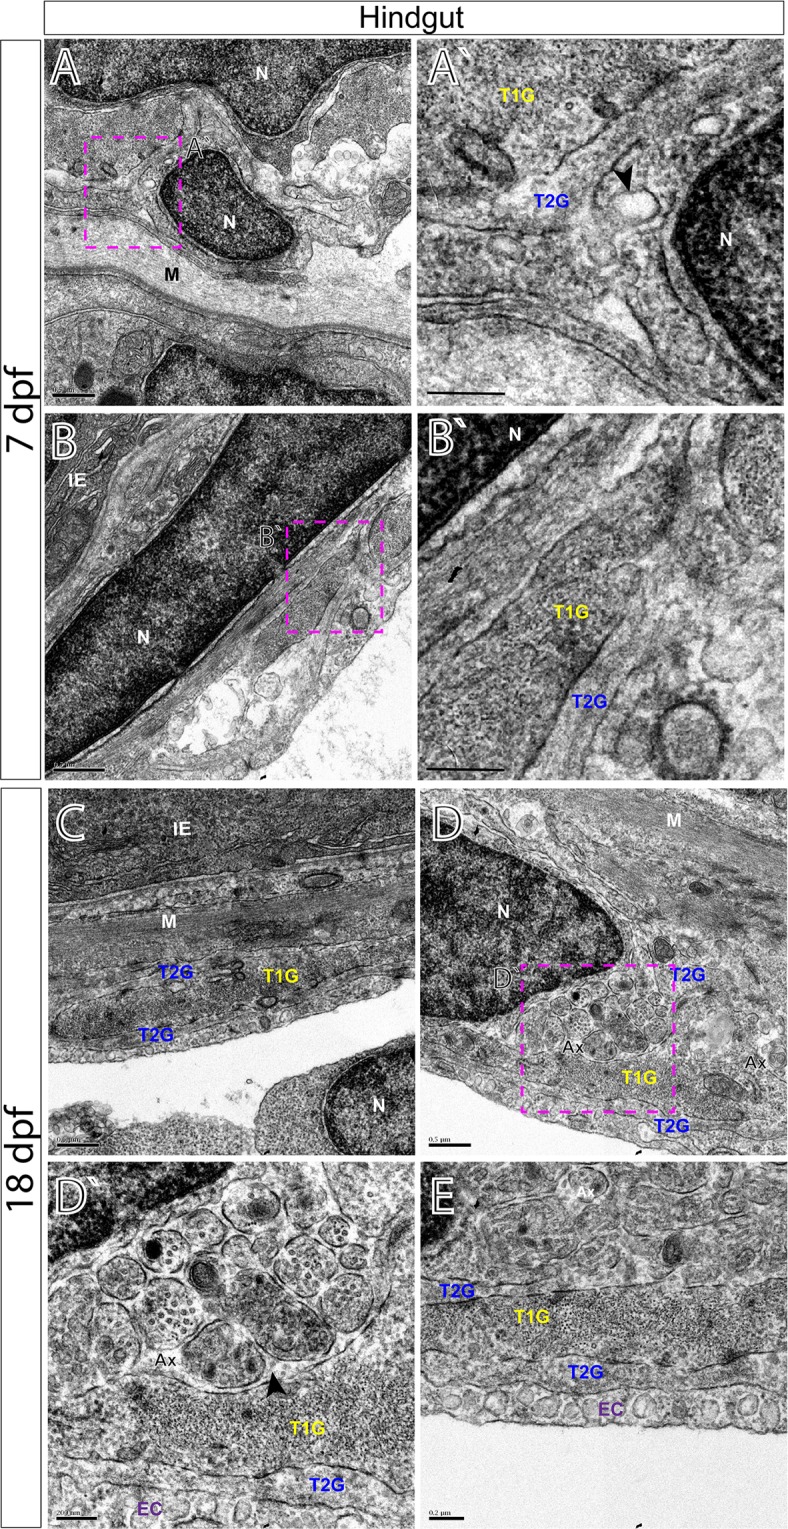
Figure 8.

TEM characterizes glial cells and ultrastructure within the larval zebrafish hindgut. TEM reveals ultrastructure of myenteric plexus neuropil of the hindgut in (A,B′) 7 dpf and (C–E) 18 dpf larvae. Magenta-dashed box corresponds to region of magnification (A′–D′). Intestinal epithelium (IE), nucleus (N), muscularis (M), axon (Ax), endothelial cell (EC), type 1 glial (T1G) and type 2 glia (T2G). Scale bars denote the following: (A) 500 nm, (A′) 250 nm, (B) 500 nm, (B′) 250 nm, (C) 500 nm, (D) 500 nm, (D′) 200 nm and (E) 200 nm. Black arrowhead in (A′) points to caveolae and to axon bundles in (D′).
