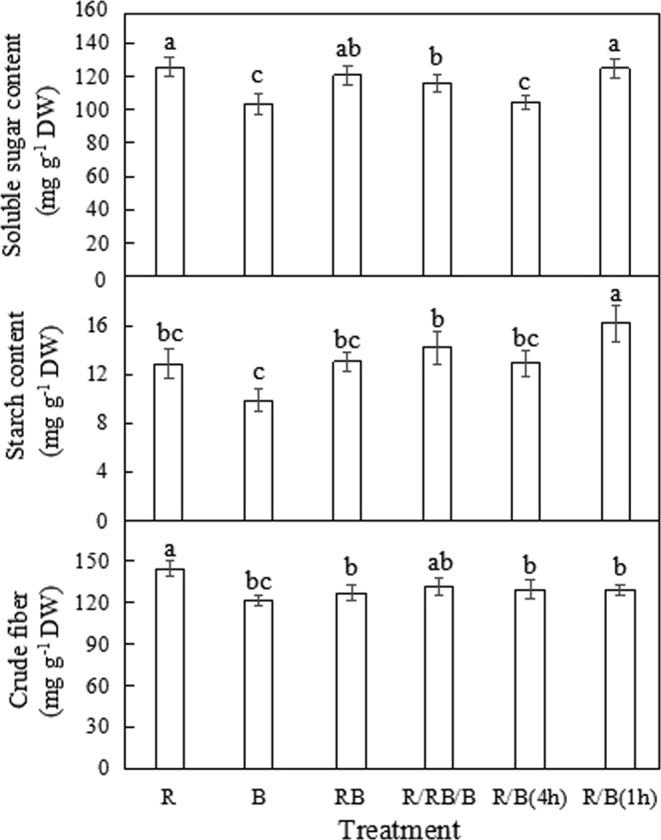
Figure 6.

The contents of soluble sugar, starch and crude fiber of lettuce (at harvest) planted in varied light treatments. Lower-case letters with the same parameter indicate significant difference at the 0.05 level by Tukey’s test, n = 3. The bars indicate the standard errors. R: monochromatic red light for 16 h over a 16-hour photoperiod; B: monochromatic blue light for 16 h over a 16-hour photoperiod; RB: simultaneous red and blue light for 8 h over a 24-hour period; R/RB/B: light switching from monochromatic red (lasted for 4 h) to simultaneous red and blue (lasted for 4 h) and then to monochromatic blue (lasted for 4 h) over a 24-hour period; R/B(4 h): alternating red and blue light with an interval of 4 h over a 16-hour photoperiod; R/B(1 h): alternating red and blue light with an interval of 1 h over a 16-hour photoperiod.
