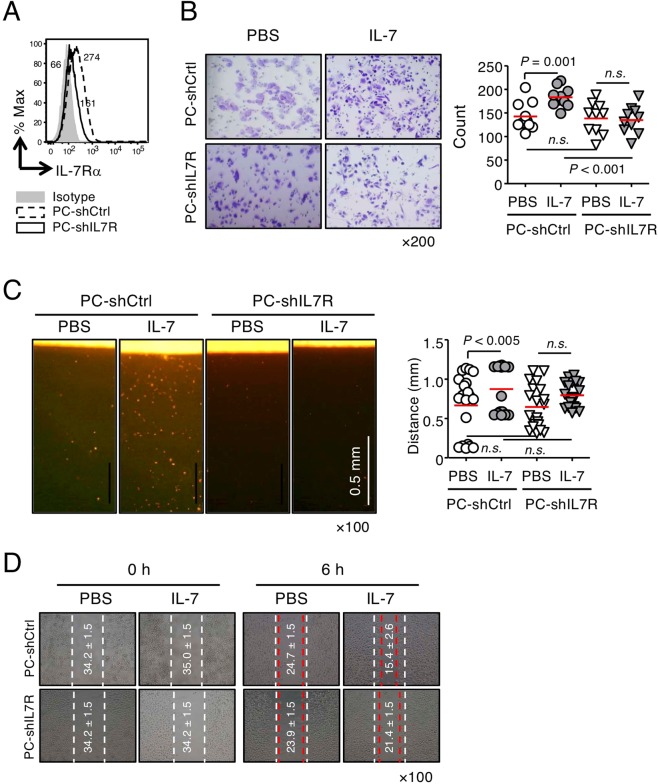
Figure 2.
Effects of IL-7 on the migration and invasion of IL-7Rα knockdown PC-3 cells. (A) IL-7Rα knockdown PC-3 (PC-shIL7R) and control cells (PC-shCtrl) were established by lentiviral transduction. Cells were stained with anti-IL-7Rα Abs and analyzed by flow cytometry. The numbers in the histogram indicate the mean fluorescence intensity. (B) Cells were left to invade through matrigel (250 μg/mL) for 24 h with or without IL-7 (10 ng/mL). Invading cells were stained with crystal violet (left panel), counted using ImageJ software, and plotted as a graph (right panel). (C) Dil-labeled cells were allowed to invade vertical collagen gel (2 mg/mL) for 18 h with or without IL-7 (10 ng/mL). Representative image of cells invading vertical collagen gel (left panel) and dot graph showing the maximum distances of cell invasion (right panel). Scale bar = 0.5 mm. (D) Wound-healing migration of PC-shIL7R and control cells was performed after IL-7 (10 ng/mL) treatment for 6 h. Dashed lines indicate the initial boundaries of the scratches (white dotted lines, 0 h) and the cell leading edges at a subsequent time point (red dotted lines, 6 h). The numbers in the picture indicate the average distances of the wound width (mean ± SEM, μm). The bars represent means. P-values were obtained using the Mann–Whitney U test (B,C). n.s., not significant. Results represent two or three independent experiments.

