Figure 5.
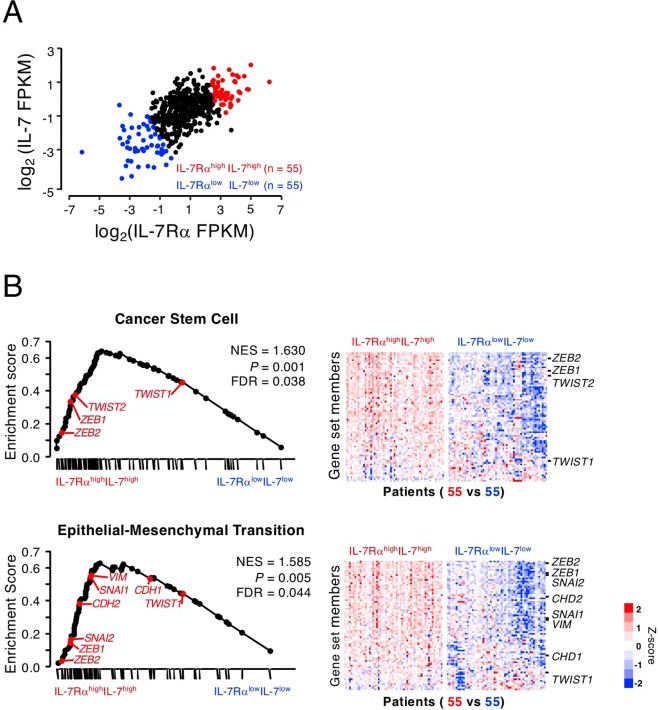
IL-7- and IL-7Rα-expressing prostate cancers showed enrichment of epithelial–mesenchymal transition (EMT) and cancer stem cells gene sets. Public data sets for prostate cancer samples (n = 551) were collected from The Cancer Genome Atlas and subjected to gene set enrichment analysis (GSEA). (A) The patient gene expression profiles were categorized after correlating IL-7Rα and IL-7 expression distributions. The top and bottom 10% of the population were defined as the IL-7Rαhigh IL-7high and IL-7Rαlow IL-7low groups (n = 55 each), respectively. (B) GSEA plots indicate significant enrichment of cancer stem cells and EMT in the IL-7RαhighIL-7high compared with IL-7RαlowIL-7low patient groups. Genes were ordered according to their ranked ratios, and GSEA was performed using the GSEA tool at http://www.broad.mit.edu/gsea. The plot (black curve) shows the enrichment score (ES), a running-sum statistic, for ranked genes compared with cancer stem cells (upper panel) and EMT (lower panel) gene set. The normalized enrichment scores (NESs) and nominal P-values are indicated. Colors are mRNA expression levels of each gene normalized by the Z score transformation.

