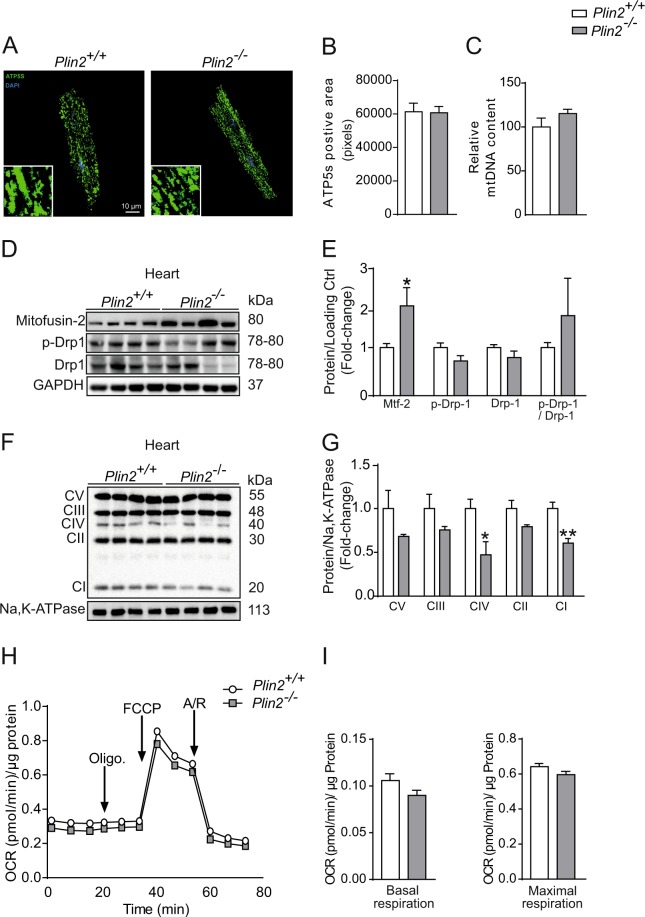
Figure 4.
Plin2-deficient cardiomyocytes have normal mitochondrial respiration (A) Representative confocal microscopy images of cardiomyocytes isolated from Plin2+/+ and Plin2−/− mice, shown as a max-stack containing 20 z-stack pictures compressed into one image, and insets show images with higher magnification. ATP5S is shown in green and nuclei staining in blue (x630 magnification, scale bar: 10 µm). (B) Quantification of ATP5s positive area (pixels) in Plin2+/+ and Plin2−/− cardiomyoctyes (n = 4–5). (C) Mitochondrial DNA (mtDNA) content (normalized to the nuclear single-copy gene β-actin) in primary cardiomyocytes isolated from Plin2+/+ and Plin2−/− mice (n = 3). (D) Representative immunoblot analysis of Mitofusin-2, p-Drp-1 and Drp-1, using heart homogenates from Plin2+/+ and Plin2−/− hearts. GAPDH and HPRT was used as loading control. Full-length blots are presented in Supplementary Fig. S8. (E) Quantification shown as fold-change compared to Plin2+/+ (n = 8–9). (F) Immunoblot analysis of OXPHOS proteins. Full-length blots are presented in Supplementary Fig. S8. (G) Quantification of F (n = 4). (H) Seahorse analysis of oxygen consumption rates (OCR) in primary cardiomyocytes isolated from Plin2+/+ and Plin2−/− mice. OCR were assessed under basal condition and following the addition of 1 µM Oligomyocin, 0.25 µM FCCP and 2 µM Antimycin A and Rotenone (n = 6–7 isolations of cardiomyocytes per genotype; each experiment performed in 12 wells). (I) The rates of basal respiration and maximal respiration are calculated as described in the method section. OCR was normalized to total cellular protein content for each well. Data are presented as mean ± SEM, *p < 0.05 vs. Plin2+/+ and **p < 0.01 vs. Plin2+/+.

