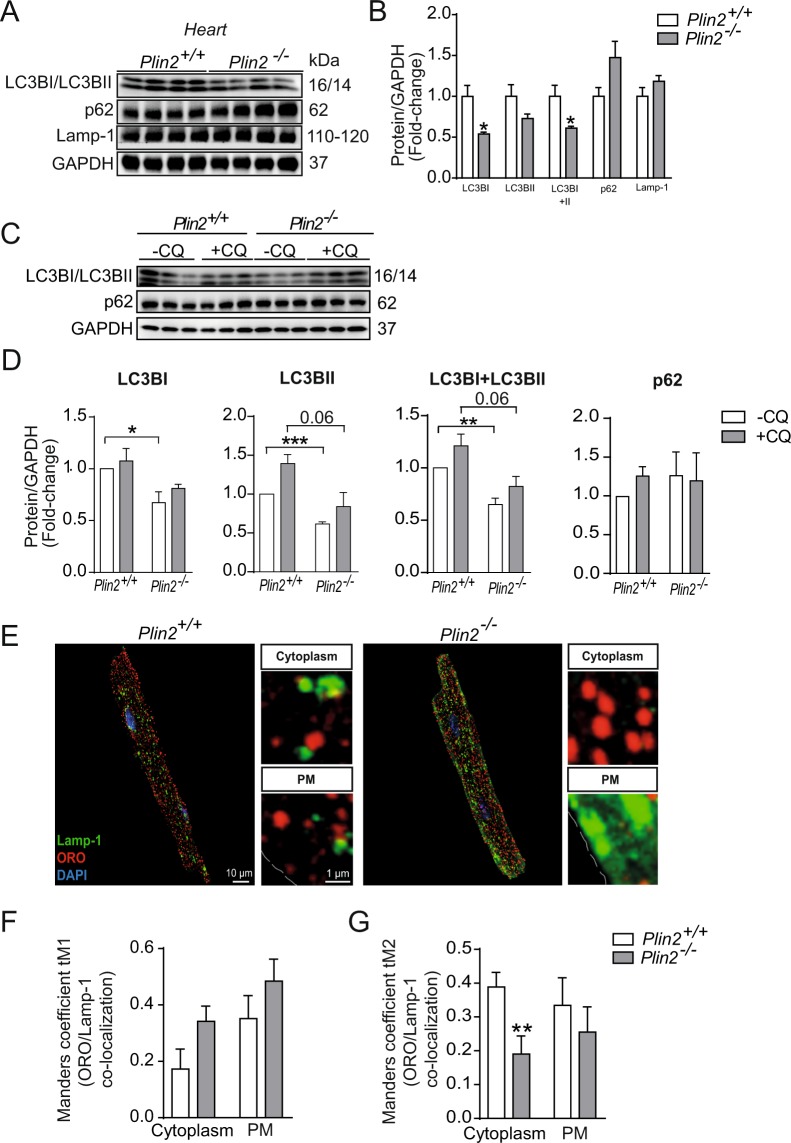
Figure 6.
Reduced lipophagy in Plin2−/− hearts. (A) Immunblot analysis of LC3BI, LC3BII, p62 and Lamp-1 in lysates from Plin2+/+ and Plin2−/− hearts after O/N fasting. Full-length blots are presented in Supplementary Fig. S10. (B) Quantification of immunoblot analysis in A (n = 4). (C) Immunblot analysis of LC3BI, LC3BII and p62 in cardiomyocytes, treated with or without 25 µM chloroquine, isolated from Plin2+/+ and Plin2−/− mice. Full-length blots are presented in Supplementary Fig. S11. (D) Quantification of immunoblot analysis in C (n = 4). (E) Representative confocal microscopy images of Plin2+/+ and Plin2−/− cardiomyocytes, shown as a max stack containing 10 z-stack images compressed into one single image, and a higher magnification z-stack image. Lamp-1 (lysosomes) is shown in green and ORO (LDs) is shown in red, nuclei in blue, and co-localization of Lamp-1 and ORO as as yellow (x630 magnification, scale bar 10 µm, inset image scale bar 1 µm). (F,G) Quantification of co-localization between lysosomes and lipid droplets. (F) Quantification of Manders coefficient tM1 (fraction of ORO in co-localization with Lamp-1) in cytosol and plasma membrane, and (G) Manders coefficient tM2 (fraction of Lamp-1 in co-localization with ORO) in cytosol and plasma membrane in cardiomyocytes isolated from Plin2+/+ and Plin2−/− mice, (n = 4–5). Data are presented as mean ± SEM, *p < 0.05 vs. Plin2+/+.

