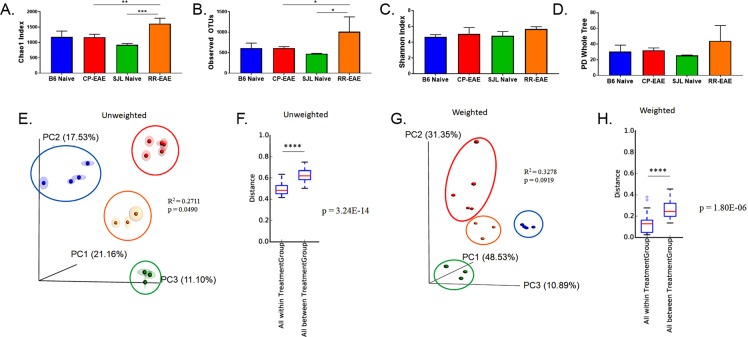
Figure 1.
Diversity of fecal microbiota. Stool samples were collected from naïve C57BL/6 (n = 4) and SJL/J (n = 3) mice or from mice exhibiting the chronic progressive (CP-EAE) (n = 5) or relapse-remitting (RR-EAE) (n = 3) EAE disease course at the initial peak of disease (day 13 post immunization) and microbial composition determined. Evaluation of microbial richness and diversity within each group (α-diversity) was assessed using the (A) Chao1 index (Naïve SJL/J vs RR-EAE p = 0.0004; CP-EAE vs RR-EAE p = 0.0052), (B) distinct number of OTUs observed (Naïve SJL/J vs RR-EAE, p = 0.0115; CP-EAE vs RR-EAE, p = 0.0351) (C) Shannon Index, and (D) Phylogenetic Diversity measure (PD Whole Tree). One-way ANOVA with Tukey’s post hoc analysis was used to generated the reported, adjusted p-values. Principle coordinate analysis (PCoA) plots were generated from (E) Unweighted and (G) Weighted UniFrac distance metrics to assess similarity between groups (β-diversity). PERMANOVA analysis was assessed using the adonis function in the vegan package of R (Unweighted p = 0.049, R2 = 0.2711; Weighted p = 0.0919, R2 = 0.3278). Distance boxplots of (F) Unweighted and (H) Weighted UniFrac metrics were used to assess diversity within and between groups. Pairwise comparison amongst “within all groups” and “between all groups” was performed using two-sample t-tests with Bonferroni correction. P-values reported are adjusted values (Unweighted, p = 3.24E-14; Weighted, p = 1.80E-06). Output was generated using the Qiime pipeline within NIH-supported microbiome analysis software Nephele.

