Figure 2.
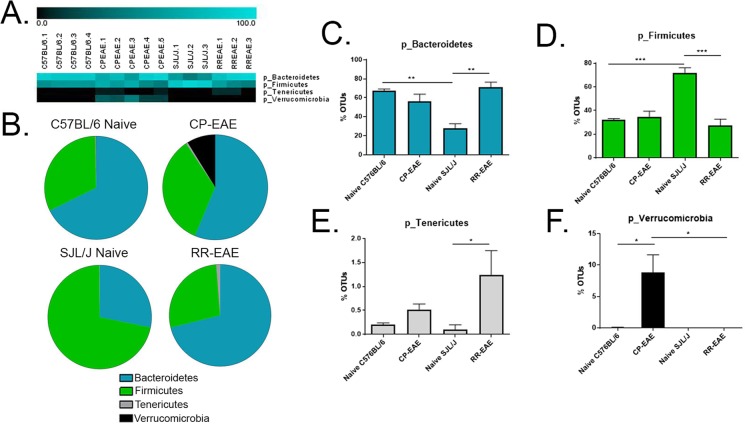
Fecal microbial composition at the Phylum Level. Stool samples were collected as described in Fig. 1 legend and microbial composition determined by 16 S rRNA V4 hypervariable sequencing using Illumina MiSeq System. (A) Heat maps represent percent total Operational Taxonomic Units (OTUs) identified in each sample (Naïve C57BL/6; C57BL/6.1-C57BL/6.4) (n = 4); (C57BL/6 EAE; CPEAE.1-CPEAE.5) (n = 5); (Naïve SJL/J; SJL/J.1-SJL/J.3) (n = 3) and (SJL/J EAE; RREAE.1-RREAE.3) (n = 3) and were generated using Genesis software. (B) Mean percent OTU abundance represented as pie chart for each group. (C–F) One-way ANOVA, followed by Tukey’s multiple comparisons, was performed in order to assess significance in the indicated phyla. Bars represent mean ± SEM and exact p-values indicated in text (*p < 0.05; **p < 0.01; ***p < 0.001; ****p < 0.0001).

