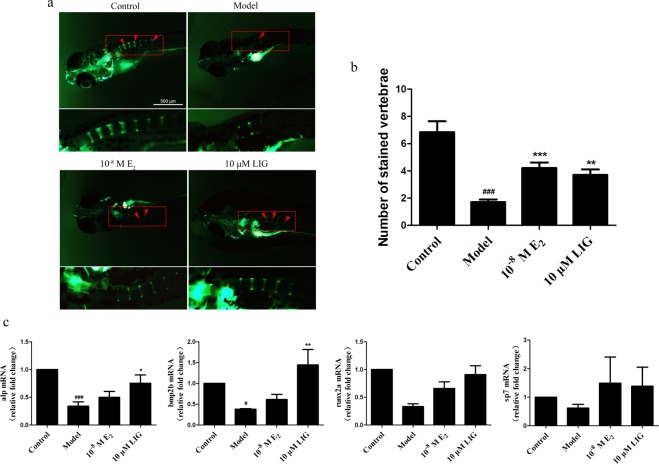
Figure 1.
LIG increases bone mass in vivo. (a) Calcein staining of zebrafish larvae at 9 dpf. Scale bars, 500 μm. Arrowheads, bone calcein staining. (b) Number of calcein-stained vertebrae in zebrafish at 9 dpf. Error bars indicate s.e.m., n = 13 for each group. ###P ≤ 0.001 vs. control group. **P ≤ 0.01, ***P ≤ 0.001 vs. model group. (c) The expression mRNA for Alp, Runx2a, sp7, and BMP2b were measured by quantitative RT-PCR in zebrafish at 9 dpf. Error bars indicate s.e.m. (n = 4). #P ≤ 0.05, ###P ≤ 0.001 vs. control group. *P ≤ 0.05, **P ≤ 0.01 vs. model group.

