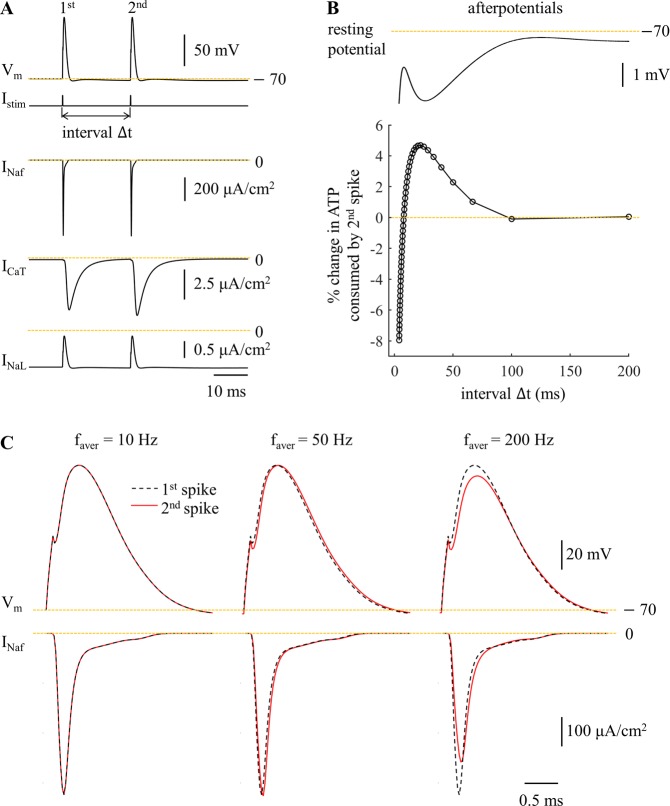
Figure 3.
Metabolic cost of pairs of APs as a function of the inter-pulse interval reflect the contributions of afterpotentials. (A) Sample responses and underlying currents (including INaf, ICaT, and INaL). Negative currents were inward. Two depolarizing pulses (amplitude: 40 nA, width: 0.1 ms) were applied to the cell body, and the inter-pulse interval was Δt = 20 ms. (B) Top: afterpotentials on the same time scale as the inter-stimulus interval, Δt. Bottom: percent change in ATP cost for the 2nd AP relative to the 1st AP as a function of Δt. The interval Δt was calculated by 1/faver, and faver was from 5 Hz to 250 Hz at a step size of 5 Hz. (C) Fast Na+ currents underlying two APs at faver = 10 Hz, 50 Hz, and 200 Hz.

