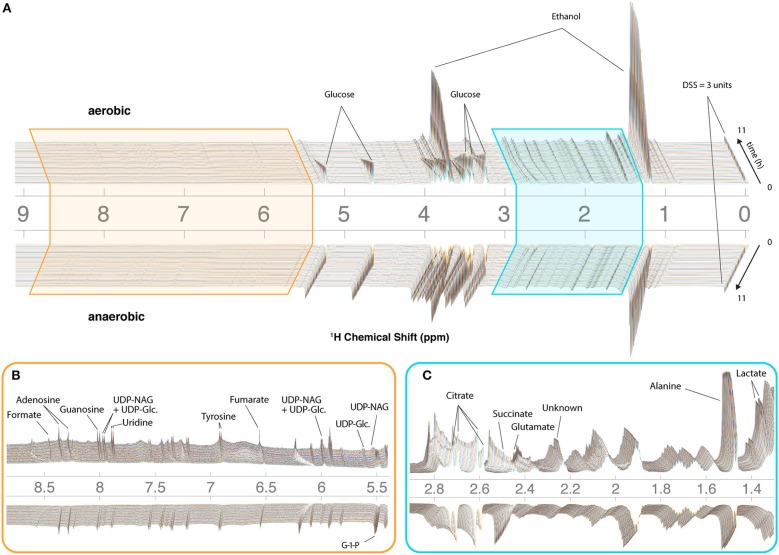
Figure 3.
CIVM-NMR measurements of N. crassa metabolism under aerobic and anaerobic conditions. 1H NMR data for one aerobic replicate (top) and one anaerobic replicate (bottom) plotted interactively as a “mirror plot” for direct comparison between conditions by peak height and position at a given time. To improve the S/N, data were analyzed at 12.7 min resolution. Annotations are shown for select peaks of interest for (A) the entire spectrum, and expansions of (B) the aromatic region and (C) the aliphatic region. Several peaks change position and intensity over the course of the experiments. UDP-NAG, UDP-N-Acetyl Glucosamine; UDP-Glc, UDP-Glucose; G-1-P, Glucose-1-Phosphate.

