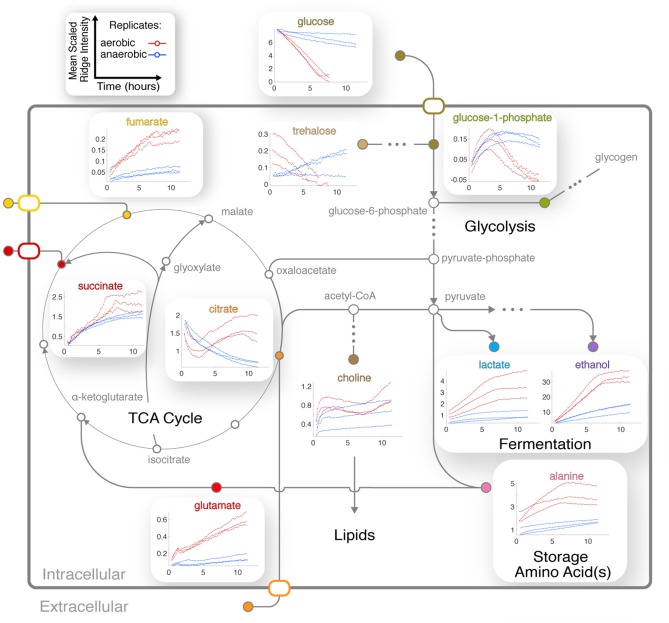
Figure 5.
Integration of central metabolic pathways. Arrows correspond to one or more reactions, and nodes correspond to metabolites (Dreyfuss et al., 2013; Kanehisa et al., 2016). Nodes are filled for observed metabolites. Plots show the means of scaled peak/ridge intensities for a given compound in a given replicate over traceable times, where red and blue trajectories represent aerobic and anaerobic conditions, respectively. Arrows indicate typical reaction directions. The glyoxylate cycle is shown as a shunt through glyoxylate embedded in the TCA cycle.

