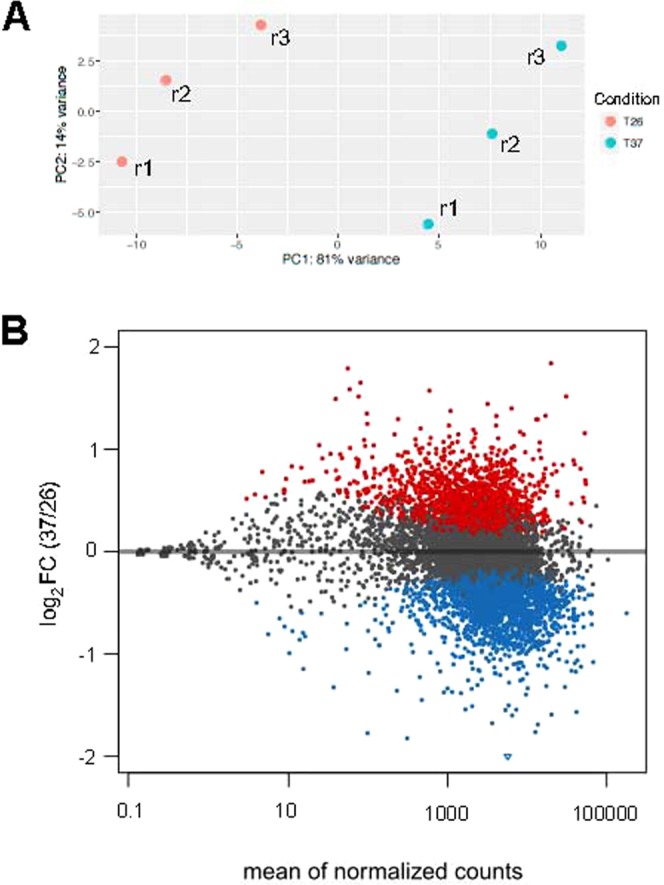
Figure 1.

Analysis of the global transcriptional changes, determined by RNA-seq, during heat shock in L. major promastigotes. (A) PCA plot of the three replicates (r1–r3) derived from each experimental condition (26 or 37 °C). (B) Differential expression analysis of the 10,700 transcripts annotated in the L. major genome. The plot shows the relationship between the mean of the normalized counts and the fold change (log2) between 26 and 37 °C conditions. Each point represents one transcript. Points colored in red or blue represent transcripts significantly up- or down-expressed at 37 °C, respectively; points colored in black correspond to transcript showing a constant expression in both conditions.
