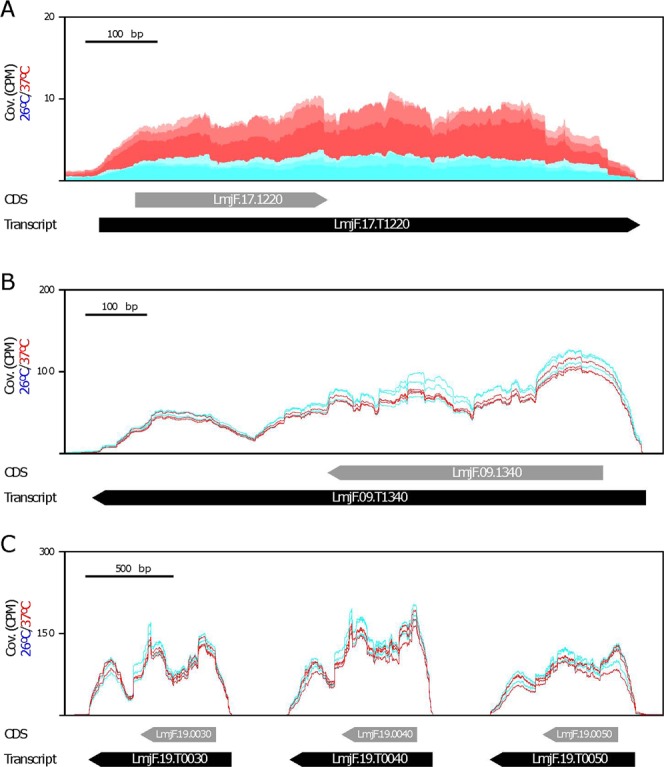
Figure 5.

Expression levels for the histone H2B transcripts. There exist three H2B loci in the L. major genome: (A) LmjF.17.1220 gene, (B) LmjF.09.1340 gene, and (C) LmjF.19.0030, LmjF.19.0040 and LmjF.19.0050 genes. Alignment of the RNA-seq reads derived from RNA samples (three biological replicates) isolated from either promastigotes growth at 26 °C (blue) or heat shocked at 37 °C (red). The location of transcripts are indicated by black arrows, whereas the location of CDS is shown by grey arrows. Coverage (Cov.) is expressed as counts per million of reads (CPM).
