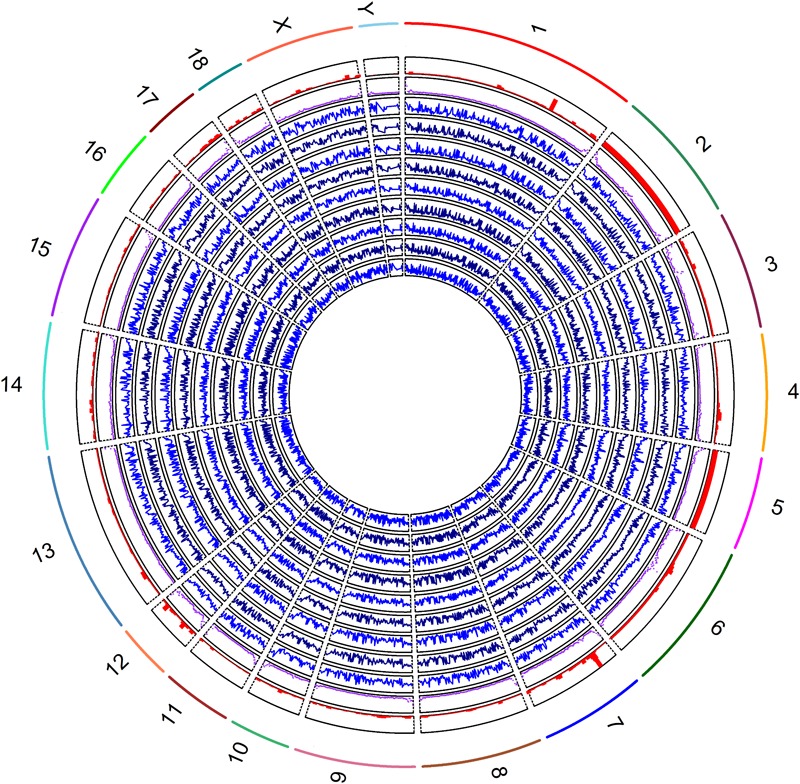
FIGURE 2.

Global methylation levels of nine samples was shown by lines of in blue (track 1, 2, 3, 4, 5, 6 7, 8, and 9) from inside to outside. The methylation levels and the densities of CpG islands by scatter plot in purple color (track 10), and genes by histograms in red color (track 11) were counted by 1 Mb windows. The labels of outside track represented the chromosomes of the porcine genome.
