FIGURE 6.

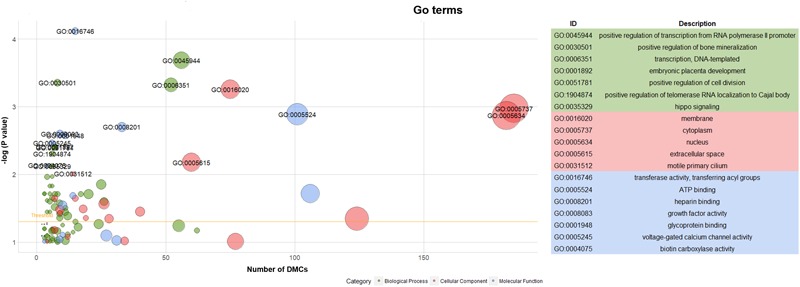
Go term analysis of genes associated with DMCs. Note: Yellow line in the left panel meant the threshold of significant GO terms (P < 0.05).

Go term analysis of genes associated with DMCs. Note: Yellow line in the left panel meant the threshold of significant GO terms (P < 0.05).