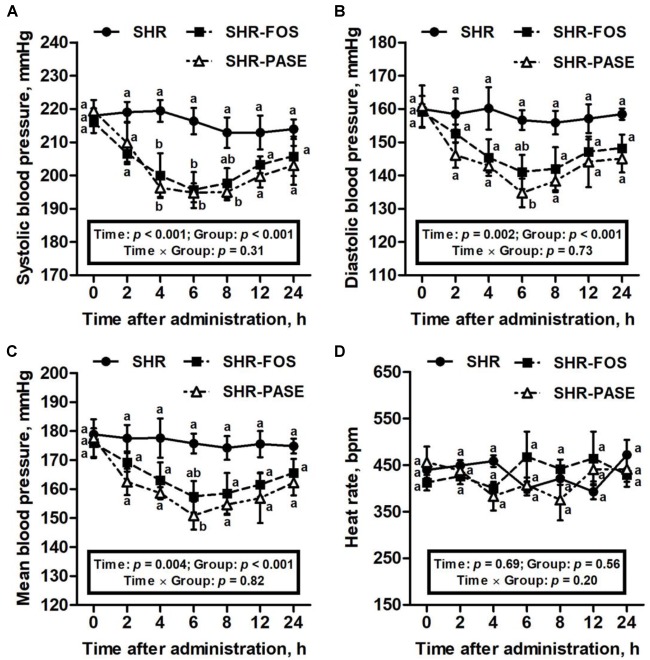
FIGURE 1.
Effect of PASE on blood pressure and heart rate after single administration. Systolic (A), diastolic (B), mean blood pressure (C), and heart rat (D) changes of SHR after being singly administrated with PASE. Data are presented by means ± SE; n = 6 per group. Blood pressures and heart rates were analyzed by two-way ANOVA with between (groups) and within (hours) subject factors, and data on each time point were by one-way MANOVA with Bonferroni post hoc test. Labeled means without a common letter differ indicated a significant difference, p < 0.05 (a > b) between groups.

