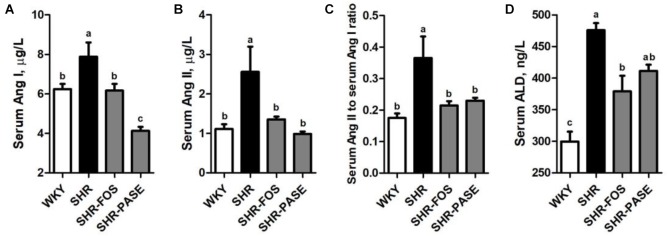
FIGURE 6.
Effect of PASE on renin-angiotensin-aldosterone system. Serum Ang I (A) and Ang II (B); the ratio of serum Ang II and Ang I (C); and serum ALD (D) concentrations in SHR after PASE treatment for 12 weeks. Data are presented as means ± SE; n = 6 per group. Statistical analyses were performed by one-way ANOVA with Bonferroni post hoc test. Labeled means without a common letter indicated a significant difference at p < 0.05 (a > b > c) between groups.

