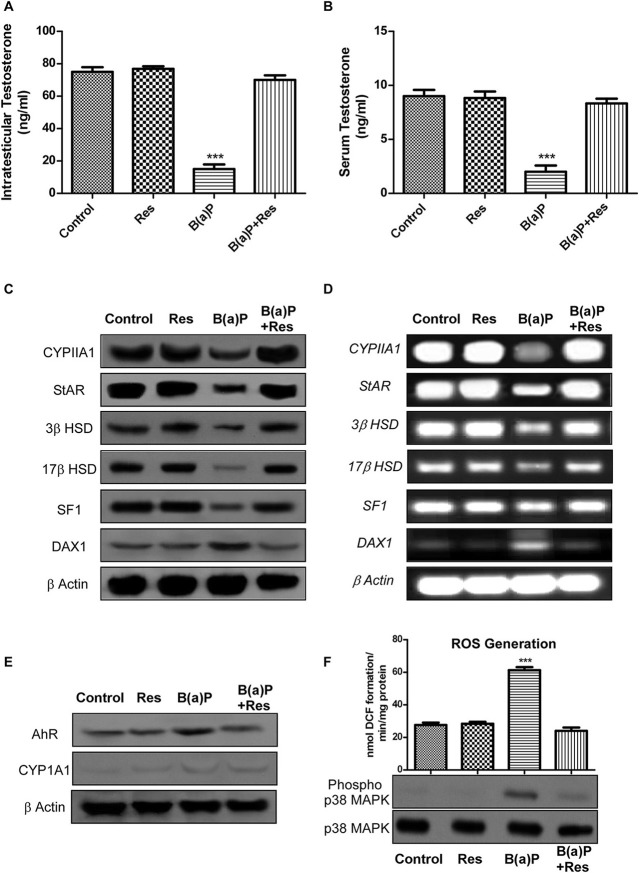
Figure 1.
Graphical representation of the level of (A) intra-testicular Testosterone (ng/ml) and (B) serum Testosterone (ng/ml). (C) Western blot and (D) RT-PCR of CYP11A1, StAR, 3β HSD, 17β HSD, SF1, and DAX1 with isolated testicular Leydig cells. (E) Western blot of AhR and CYP1A1 with isolated Leydig cells. β Actin was used as the loading control. (F) ROS generation in isolated testicular Leydig cells; Western blot of phospho and complete p38 MAPK (lower panel). At least three independent experiments were performed. Histogram is expressing the value of, mean ± SEM. One-way ANOVA was followed by Dunnett multiple comparison test. The level of significance was set at ***(P < 0.001) as compared with control. B(a)P, Benzo(a)pyrene (5 mg/kg); Res, Resveratrol (50 mg/kg).

