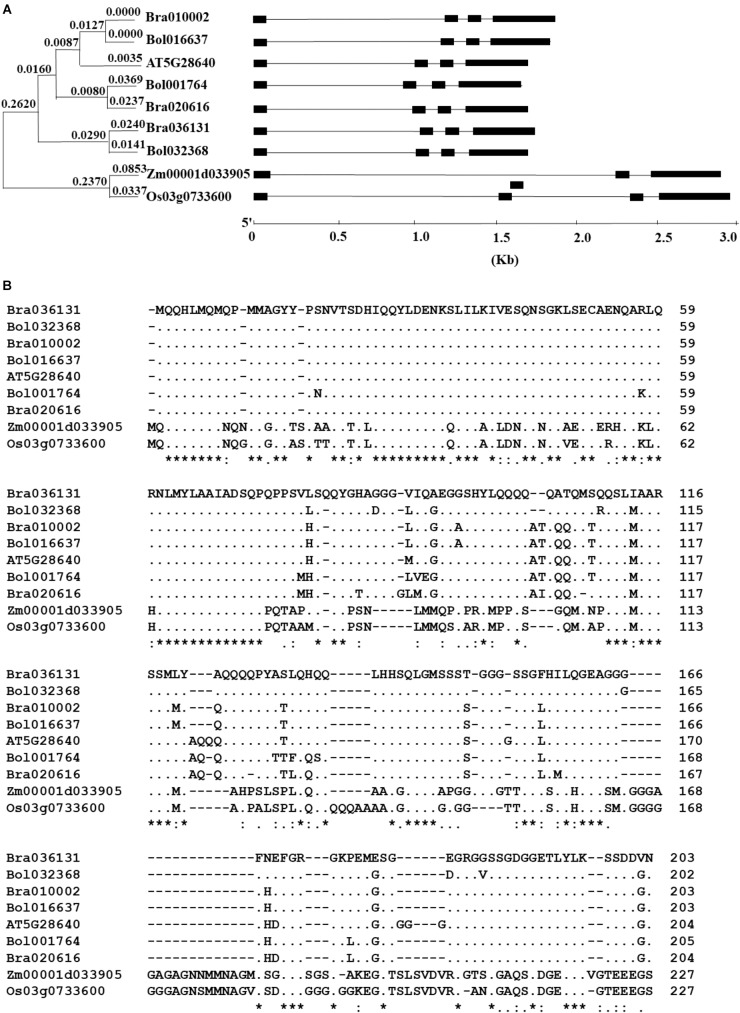
FIGURE 1.
Comparison of the homologs of the AtAN3 protein in Brassica rapa, B. oleracea, Zea mays, and Oryza sativa. (A) Phylogenetic relationship and gene structures of the homologs of the AtAN3 protein in those species. The unrooted phylogenetic tree was generated by the neighbor-joining method using the MEGA5 program with 1,000 bootstraps. Lines represent the introns while solid boxes represent exons. (B) Comparison of the deduced amino acid sequences of the homologs of the AtAN3 protein in those species. Dashes represent gaps, dots represent the identical amino acid residues, and the numbers represent the length of the amino acid residues.

