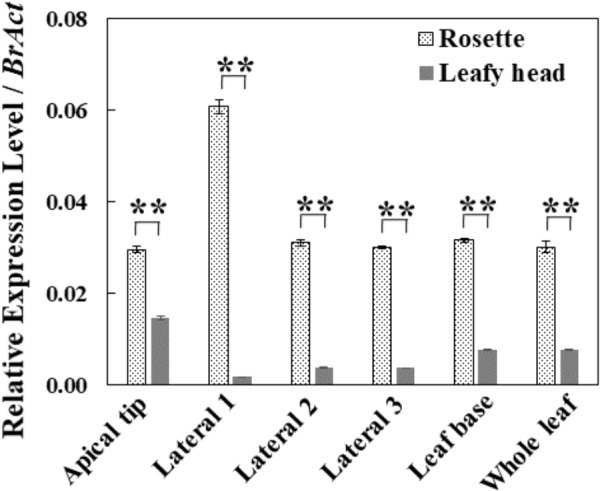
FIGURE 2.

Relative expression levels of BrAN3 in different leaf positions and the whole leaf of Chinese cabbage at the rosette and heading stages measured by real-time RT-PCR. Total RNA was extracted from the apical location, the lateral 1∼3 locations, and the base location of individual leaves and the whole leaves of Chinese cabbage (Gao et al., 2017) at both the rosette and heading stages, respectively. BrAN3-specific primers were designed to target all the three homologous sequences of BrAN3 in Chinese cabbage. Relative expression levels were calculated using the standard curve method with BrAct (Bra028615; Dheda et al., 2004) as the internal control gene. Bars represent the means of three replicates ± standard errors (vertical bars). Asterisks indicate a significant difference between the two stages at p ≤ 0.05 as calculated by t-test.
