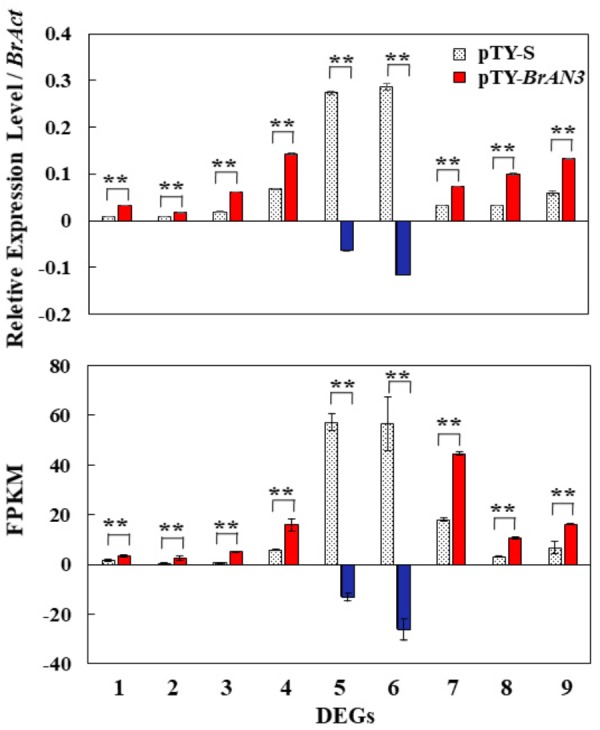
FIGURE 7.

Validation of the expression of 9 out of the 41 differential expression genes (DEGs) by real-time RT-PCR. Gene-specific primers were designed to target all the homologous sequences of each gene in Chinese cabbage. Relative expression levels were calculated using the standard curve method with BrAct (Bra028615; Dheda et al., 2004) as the internal control gene. The FPKM expression levels were calculated as fragments per kilobase of exon model per million mapped (FPKM) values. Bars represent the means of three replicates ± standard errors (vertical bars). Genes: 1, Bra011332; 2, Bra014411; 3, Bra023958; 4, Bra027232; 5, Bra003044; 6, Bra022663; 7, Bra005136; 8, Bra017136; 9, Bra025708. Asterisks indicate a significant difference between pTY-S- and pTY-BrAN3-inoculated plants at p ≤ 0.01 as calculated by t-test.
