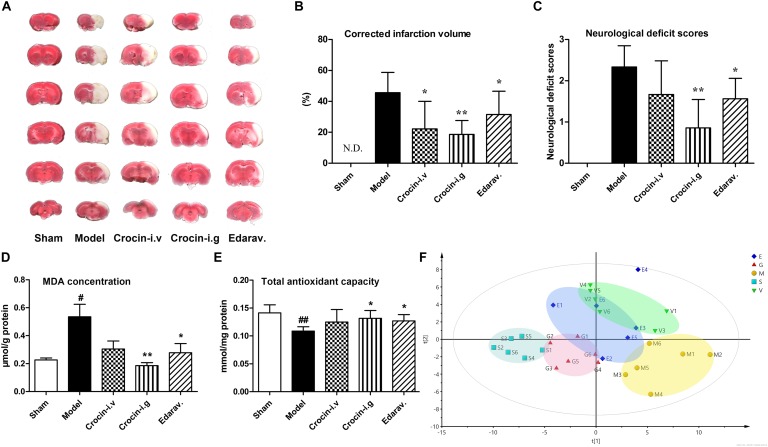
FIGURE 2.
Oral administration of crocin elicits superior cerebral-protective effects over intravenous administration. (A) Representative images of six serial sections from the same brain (top to bottom) prepared 24 h after MCAO and stained with TTC. The red areas represent normal brain tissues, and the white areas represent the infarct tissues. (B) Average infarction volumes corrected for brain edema as indicated (n = 6), N.D., infarction not detected. ∗P < 0.05, ∗∗P < 0.01 vs. model group. (C) Neurological deficit scores in each group. ∗P < 0.05, ∗∗P < 0.01 vs. model group. (D) Malondialdehyde (MDA) and (E) total antioxidant capacity of brain tissues in the infarction region. Data are presented as the mean ± SD (n = 6), #P < 0.05, ##P < 0.01 vs. sham group; ∗P < 0.05, ∗∗P < 0.01 vs. model group. (F) PLS-DA scores plots of brain tissues collected 24 h after MCAO. S, sham-operated group; M, model group; E, edaravone; G, crocin (i.g. administration) group; V, crocin (i.v. administration) group.

