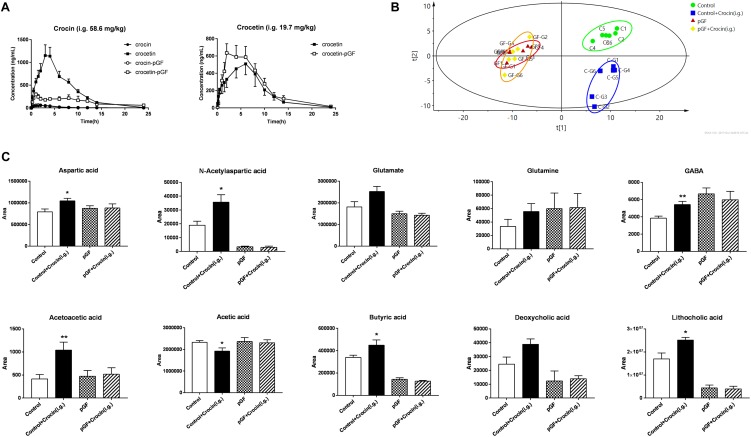
FIGURE 7.
The cross-interaction between gut microbiota and crocin was abolished in pGF rats. (A) PK curves of crocin and crocetin after oral administration (crocin, 58.6 mg/kg; crocetin, 19.7 mg/kg) (mean ± SD, n = 6); (B) PLS-DA scores plots of gut content collected 6 h after crocin or vehicle administration. (C) The metabolites identified to be significantly different between crocin administered and control rats, (mean ± SD, n = 6). ∗P < 0.05, ∗∗P < 0.01 vs. control group.

