Figure 3.
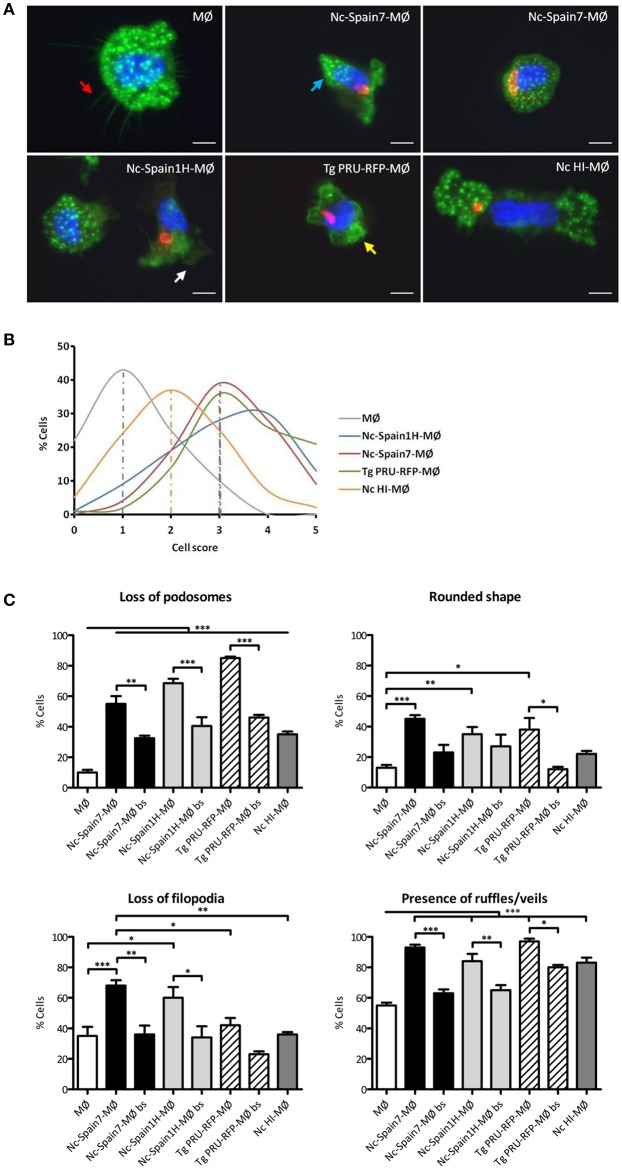
Morphological changes in bovine MØs induced by N. caninum and T. gondii active invasion. (A) Representative micrographs of non-infected MØs (MØ) and MØs challenged for 8 h with N. caninum Nc-Spain7 (Nc-Spain7-MØ), Nc-Spain1H (Nc-Spain1H-MØ), heat-inactivated tachyzoites (Nc HI-MØ), or T. gondii PRU-RFP (Tg PRU-RFP-MØ). F-actin is presented in green, nuclei in blue and parasites in red. Cell structures studied are pointed with arrows: podosomes (blue), filopodia-like extensions (red), ruffles (yellow), and veils (white). Scale bar is 10 μm. (B) The distribution of the total scores obtained are presented as the percentage relative to the total population of MØs, Nc-Spain7-MØs, Nc-Spain1H-MØs, Tg PRU-RFP-MØs, and Nc HI-MØs. Cells were graded according to the following morphological criteria: (i) Podosome structures: present (score 0) vs. reduced (score 1) or absent (score 2); (ii) Cell shape: elongated (score 0) vs. rounded (score 1); (iii) Filopodia-like extensions: present (score 0) vs. absent (score 1); iv) Membrane veils and/or ruffles: present (score 0) vs. absent (score 1). (C) Bar graph indicates the percentage of cells that exhibited podosome loss, a rounded shape, filopodia-like extension loss and the presence of ruffles or veils, relative to the total cell population of unchallenged, infected and non-infected by-stander MØs (bs). A total of 100 cells were analyzed for each condition on four coverslips from two independent experiments. Significant differences are indicated (*p < 0.05; **p < 0.01; ***p < 0.001).

