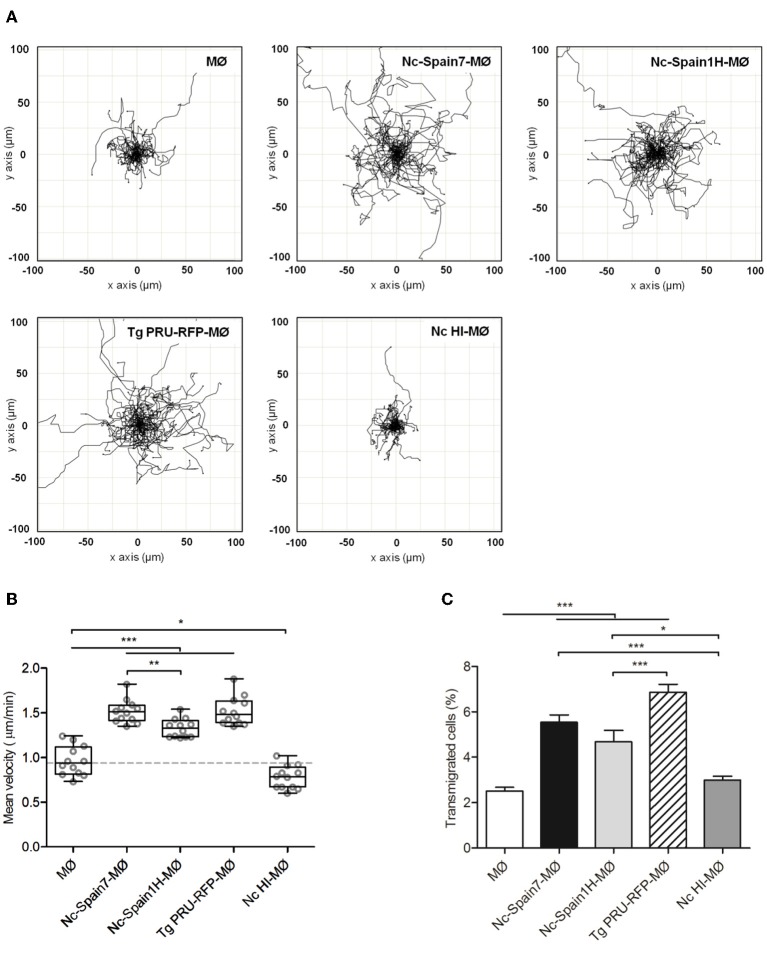
Figure 5.
Hypermotile phenotype and enhanced transmigration in bovine MØs induced by N. caninum infection. (A) Motility plot of unchallenged MØs (MØ) and MØs challenged for 4 h with N. caninum Nc-Spain7 (Nc-Spain7-MØ), Nc-Spain1H (Nc-Spain1H-MØ), heat-inactivated tachyzoites (Nc HI-MØ) or T. gondii PRU-RFP tachyzoites (Tg PRU-RFP-MØ). (B) Graph represents the mean velocity and SEM of three independent experiments. Circles indicate the average velocity of 50 cells tracked in two different tiles and two different wells per experiment. Box plot shows upper and lower interquartile range with median. (C) The graph represents the percentage of transmigration 18 hpi of MØs, Nc-Spain7-MØs, Nc-Spain1H-MØs, Nc HI-MØs, and Tg PRU-RFP-MØs. The data represent the mean values and SD of three independent experiments; Significant differences are indicated (*p < 0.05; **p < 0.01; ***p < 0.001).

