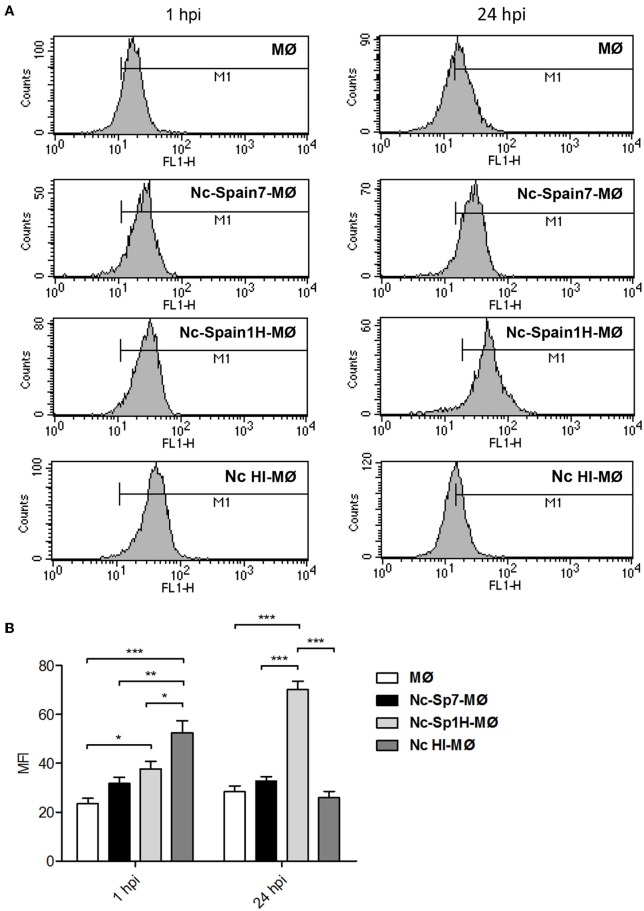
Figure 6.
ROS generation induced by N. caninum infection. (A) Representative histograms show the mean fluorescence intensity (MFI) determined by flow cytometry analysis of non-infected MØs (MØ), MØs challenged for 1 and 24 h with N. caninum Nc-Spain7 (Nc-Spain7-MØ), Nc-Spain1H (Nc-Spain1H-MØ), and heat-inactivated tachyzoites (Nc HI-MØ) stained with CellROX Green Reagent. (B) The bar graph show the comparison of the MFI between groups. Each column and error bar represents the mean and SD of three replicates from three independent experiments; Significant differences are indicated (*p < 0.05; **p < 0.01; ***p < 0.001).

